

The external fund manager backed by Berkshire Hathaway's Charlie Munger, Li Lu, makes no bones about it when he says 'The biggest investment risk is not the volatility of prices, but whether you will suffer a permanent loss of capital.' It's only natural to consider a company's balance sheet when you examine how risky it is, since debt is often involved when a business collapses. We can see that Lannett Company, Inc. (NYSE:LCI) does use debt in its business. But the more important question is: how much risk is that debt creating?
Why Does Debt Bring Risk?
Debt and other liabilities become risky for a business when it cannot easily fulfill those obligations, either with free cash flow or by raising capital at an attractive price. Part and parcel of capitalism is the process of 'creative destruction' where failed businesses are mercilessly liquidated by their bankers. However, a more frequent (but still costly) occurrence is where a company must issue shares at bargain-basement prices, permanently diluting shareholders, just to shore up its balance sheet. Of course, the upside of debt is that it often represents cheap capital, especially when it replaces dilution in a company with the ability to reinvest at high rates of return. The first thing to do when considering how much debt a business uses is to look at its cash and debt together.
View our latest analysis for Lannett Company
What Is Lannett Company's Net Debt?
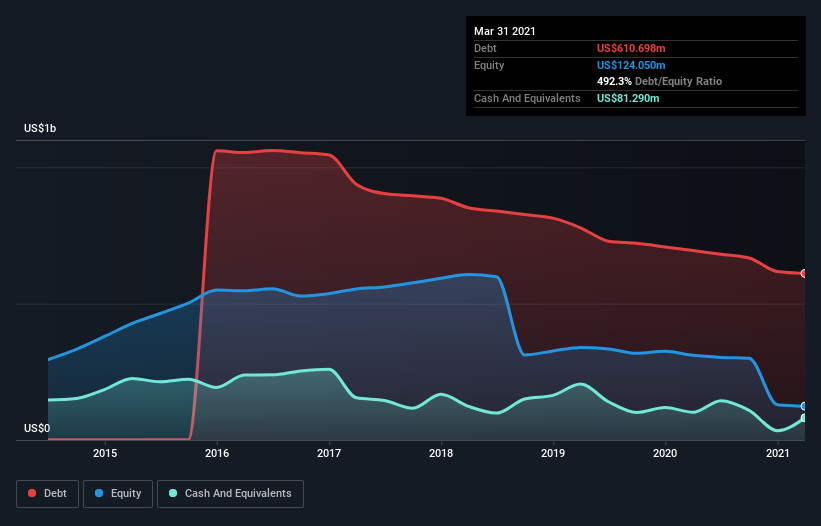
You can click the graphic below for the historical numbers, but it shows that Lannett Company had US$610.7m of debt in March 2021, down from US$694.6m, one year before. However, because it has a cash reserve of US$81.3m, its net debt is less, at about US$529.4m.
A Look At Lannett Company's Liabilities
According to the last reported balance sheet, Lannett Company had liabilities of US$97.1m due within 12 months, and liabilities of US$641.2m due beyond 12 months. Offsetting these obligations, it had cash of US$81.3m as well as receivables valued at US$154.7m due within 12 months. So it has liabilities totalling US$502.3m more than its cash and near-term receivables, combined.
This deficit casts a shadow over the US$187.7m company, like a colossus towering over mere mortals. So we'd watch its balance sheet closely, without a doubt. At the end of the day, Lannett Company would probably need a major re-capitalization if its creditors were to demand repayment.
In order to size up a company's debt relative to its earnings, we calculate its net debt divided by its earnings before interest, tax, depreciation, and amortization (EBITDA) and its earnings before interest and tax (EBIT) divided by its interest expense (its interest cover). This way, we consider both the absolute quantum of the debt, as well as the interest rates paid on it.
Lannett Company shareholders face the double whammy of a high net debt to EBITDA ratio (9.5), and fairly weak interest coverage, since EBIT is just 0.047 times the interest expense. The debt burden here is substantial. Even worse, Lannett Company saw its EBIT tank 96% over the last 12 months. If earnings continue to follow that trajectory, paying off that debt load will be harder than convincing us to run a marathon in the rain. There's no doubt that we learn most about debt from the balance sheet. But it is future earnings, more than anything, that will determine Lannett Company's ability to maintain a healthy balance sheet going forward. So if you want to see what the professionals think, you might find this free report on analyst profit forecasts to be interesting.
Finally, a business needs free cash flow to pay off debt; accounting profits just don't cut it. So we always check how much of that EBIT is translated into free cash flow. Happily for any shareholders, Lannett Company actually produced more free cash flow than EBIT over the last three years. There's nothing better than incoming cash when it comes to staying in your lenders' good graces.
Our View
On the face of it, Lannett Company's EBIT growth rate left us tentative about the stock, and its level of total liabilities was no more enticing than the one empty restaurant on the busiest night of the year. But on the bright side, its conversion of EBIT to free cash flow is a good sign, and makes us more optimistic. Taking into account all the aforementioned factors, it looks like Lannett Company has too much debt. While some investors love that sort of risky play, it's certainly not our cup of tea. When analysing debt levels, the balance sheet is the obvious place to start. However, not all investment risk resides within the balance sheet - far from it. To that end, you should be aware of the 3 warning signs we've spotted with Lannett Company .
If you're interested in investing in businesses that can grow profits without the burden of debt, then check out this free list of growing businesses that have net cash on the balance sheet.
If you’re looking to trade Lannett Company, open an account with the lowest-cost* platform trusted by professionals, Interactive Brokers. Their clients from over 200 countries and territories trade stocks, options, futures, forex, bonds and funds worldwide from a single integrated account. Promoted
If you're looking to trade Lannett Company, open an account with the lowest-cost platform trusted by professionals, Interactive Brokers.
With clients in over 200 countries and territories, and access to 160 markets, IBKR lets you trade stocks, options, futures, forex, bonds and funds from a single integrated account.
Enjoy no hidden fees, no account minimums, and FX conversion rates as low as 0.03%, far better than what most brokers offer.
Sponsored ContentNew: AI Stock Screener & Alerts
Our new AI Stock Screener scans the market every day to uncover opportunities.
• Dividend Powerhouses (3%+ Yield)
• Undervalued Small Caps with Insider Buying
• High growth Tech and AI Companies
Or build your own from over 50 metrics.
This article by Simply Wall St is general in nature. It does not constitute a recommendation to buy or sell any stock, and does not take account of your objectives, or your financial situation. We aim to bring you long-term focused analysis driven by fundamental data. Note that our analysis may not factor in the latest price-sensitive company announcements or qualitative material. Simply Wall St has no position in any stocks mentioned.
*Interactive Brokers Rated Lowest Cost Broker by StockBrokers.com Annual Online Review 2020
Have feedback on this article? Concerned about the content? Get in touch with us directly. Alternatively, email editorial-team (at) simplywallst.com.
About OTCPK:LCIN.Q
Lannett Company
Lannett Company, Inc. develops, manufactures, packages, markets, and distributes generic versions of brand pharmaceutical products in the United States.
Slightly overvalued with weak fundamentals.
Similar Companies
Market Insights

Community Narratives


