

Key Insights
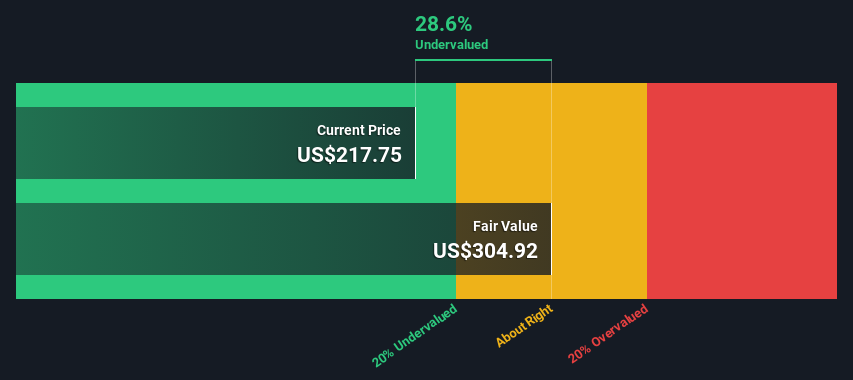
- The projected fair value for IQVIA Holdings is US$305 based on 2 Stage Free Cash Flow to Equity
- IQVIA Holdings' US$218 share price signals that it might be 29% undervalued
- Our fair value estimate is 25% higher than IQVIA Holdings' analyst price target of US$244
Today we'll do a simple run through of a valuation method used to estimate the attractiveness of IQVIA Holdings Inc. (NYSE:IQV) as an investment opportunity by estimating the company's future cash flows and discounting them to their present value. We will use the Discounted Cash Flow (DCF) model on this occasion. It may sound complicated, but actually it is quite simple!
We would caution that there are many ways of valuing a company and, like the DCF, each technique has advantages and disadvantages in certain scenarios. Anyone interested in learning a bit more about intrinsic value should have a read of the Simply Wall St analysis model.
View our latest analysis for IQVIA Holdings
Crunching The Numbers
We use what is known as a 2-stage model, which simply means we have two different periods of growth rates for the company's cash flows. Generally the first stage is higher growth, and the second stage is a lower growth phase. To begin with, we have to get estimates of the next ten years of cash flows. Where possible we use analyst estimates, but when these aren't available we extrapolate the previous free cash flow (FCF) from the last estimate or reported value. We assume companies with shrinking free cash flow will slow their rate of shrinkage, and that companies with growing free cash flow will see their growth rate slow, over this period. We do this to reflect that growth tends to slow more in the early years than it does in later years.
A DCF is all about the idea that a dollar in the future is less valuable than a dollar today, and so the sum of these future cash flows is then discounted to today's value:
10-year free cash flow (FCF) estimate
| 2024 | 2025 | 2026 | 2027 | 2028 | 2029 | 2030 | 2031 | 2032 | 2033 | |
| Levered FCF ($, Millions) | US$1.89b | US$2.11b | US$2.42b | US$2.73b | US$3.06b | US$3.30b | US$3.50b | US$3.67b | US$3.82b | US$3.96b |
| Growth Rate Estimate Source | Analyst x7 | Analyst x6 | Analyst x2 | Analyst x2 | Analyst x2 | Est @ 7.84% | Est @ 6.15% | Est @ 4.97% | Est @ 4.15% | Est @ 3.57% |
| Present Value ($, Millions) Discounted @ 7.6% | US$1.8k | US$1.8k | US$1.9k | US$2.0k | US$2.1k | US$2.1k | US$2.1k | US$2.0k | US$2.0k | US$1.9k |
("Est" = FCF growth rate estimated by Simply Wall St)
Present Value of 10-year Cash Flow (PVCF) = US$20b
After calculating the present value of future cash flows in the initial 10-year period, we need to calculate the Terminal Value, which accounts for all future cash flows beyond the first stage. For a number of reasons a very conservative growth rate is used that cannot exceed that of a country's GDP growth. In this case we have used the 5-year average of the 10-year government bond yield (2.2%) to estimate future growth. In the same way as with the 10-year 'growth' period, we discount future cash flows to today's value, using a cost of equity of 7.6%.
Terminal Value (TV)= FCF2033 × (1 + g) ÷ (r – g) = US$4.0b× (1 + 2.2%) ÷ (7.6%– 2.2%) = US$75b
Present Value of Terminal Value (PVTV)= TV / (1 + r)10= US$75b÷ ( 1 + 7.6%)10= US$36b
The total value is the sum of cash flows for the next ten years plus the discounted terminal value, which results in the Total Equity Value, which in this case is US$56b. In the final step we divide the equity value by the number of shares outstanding. Relative to the current share price of US$218, the company appears a touch undervalued at a 29% discount to where the stock price trades currently. The assumptions in any calculation have a big impact on the valuation, so it is better to view this as a rough estimate, not precise down to the last cent.
The Assumptions
Now the most important inputs to a discounted cash flow are the discount rate, and of course, the actual cash flows. You don't have to agree with these inputs, I recommend redoing the calculations yourself and playing with them. The DCF also does not consider the possible cyclicality of an industry, or a company's future capital requirements, so it does not give a full picture of a company's potential performance. Given that we are looking at IQVIA Holdings as potential shareholders, the cost of equity is used as the discount rate, rather than the cost of capital (or weighted average cost of capital, WACC) which accounts for debt. In this calculation we've used 7.6%, which is based on a levered beta of 1.082. Beta is a measure of a stock's volatility, compared to the market as a whole. We get our beta from the industry average beta of globally comparable companies, with an imposed limit between 0.8 and 2.0, which is a reasonable range for a stable business.
SWOT Analysis for IQVIA Holdings
- Debt is well covered by earnings.
- Earnings declined over the past year.
- Annual earnings are forecast to grow faster than the American market.
- Trading below our estimate of fair value by more than 20%.
- Debt is not well covered by operating cash flow.
- Annual revenue is forecast to grow slower than the American market.
Moving On:
Valuation is only one side of the coin in terms of building your investment thesis, and it is only one of many factors that you need to assess for a company. It's not possible to obtain a foolproof valuation with a DCF model. Rather it should be seen as a guide to "what assumptions need to be true for this stock to be under/overvalued?" If a company grows at a different rate, or if its cost of equity or risk free rate changes sharply, the output can look very different. What is the reason for the share price sitting below the intrinsic value? For IQVIA Holdings, we've compiled three relevant aspects you should explore:
- Risks: Consider for instance, the ever-present spectre of investment risk. We've identified 1 warning sign with IQVIA Holdings , and understanding it should be part of your investment process.
- Future Earnings: How does IQV's growth rate compare to its peers and the wider market? Dig deeper into the analyst consensus number for the upcoming years by interacting with our free analyst growth expectation chart.
- Other Solid Businesses: Low debt, high returns on equity and good past performance are fundamental to a strong business. Why not explore our interactive list of stocks with solid business fundamentals to see if there are other companies you may not have considered!
PS. The Simply Wall St app conducts a discounted cash flow valuation for every stock on the NYSE every day. If you want to find the calculation for other stocks just search here.
New: AI Stock Screener & Alerts
Our new AI Stock Screener scans the market every day to uncover opportunities.
• Dividend Powerhouses (3%+ Yield)
• Undervalued Small Caps with Insider Buying
• High growth Tech and AI Companies
Or build your own from over 50 metrics.
Have feedback on this article? Concerned about the content? Get in touch with us directly. Alternatively, email editorial-team (at) simplywallst.com.
This article by Simply Wall St is general in nature. We provide commentary based on historical data and analyst forecasts only using an unbiased methodology and our articles are not intended to be financial advice. It does not constitute a recommendation to buy or sell any stock, and does not take account of your objectives, or your financial situation. We aim to bring you long-term focused analysis driven by fundamental data. Note that our analysis may not factor in the latest price-sensitive company announcements or qualitative material. Simply Wall St has no position in any stocks mentioned.
About NYSE:IQV
IQVIA Holdings
Engages in the provision of advanced analytics, technology solutions, and clinical research services to the life sciences industry in the Americas, Europe, Africa, and the Asia-Pacific.
Very undervalued with proven track record.

