
Advertisement
Some say volatility, rather than debt, is the best way to think about risk as an investor, but Warren Buffett famously said that 'Volatility is far from synonymous with risk.' So it seems the smart money knows that debt - which is usually involved in bankruptcies - is a very important factor, when you assess how risky a company is. Importantly, XOMA Corporation (NASDAQ:XOMA) does carry debt. But is this debt a concern to shareholders?
Why Does Debt Bring Risk?
Generally speaking, debt only becomes a real problem when a company can't easily pay it off, either by raising capital or with its own cash flow. Ultimately, if the company can't fulfill its legal obligations to repay debt, shareholders could walk away with nothing. However, a more frequent (but still costly) occurrence is where a company must issue shares at bargain-basement prices, permanently diluting shareholders, just to shore up its balance sheet. By replacing dilution, though, debt can be an extremely good tool for businesses that need capital to invest in growth at high rates of return. The first thing to do when considering how much debt a business uses is to look at its cash and debt together.
See our latest analysis for XOMA
What Is XOMA's Net Debt?
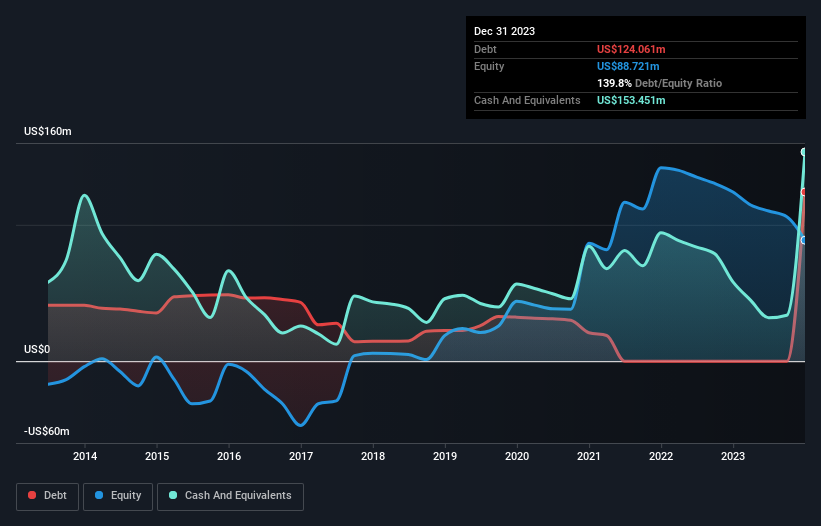
You can click the graphic below for the historical numbers, but it shows that as of December 2023 XOMA had US$124.1m of debt, an increase on none, over one year. But it also has US$153.5m in cash to offset that, meaning it has US$29.4m net cash.
A Look At XOMA's Liabilities
We can see from the most recent balance sheet that XOMA had liabilities of US$19.5m falling due within a year, and liabilities of US$126.1m due beyond that. Offsetting this, it had US$153.5m in cash and US$15.2m in receivables that were due within 12 months. So it actually has US$23.1m more liquid assets than total liabilities.
This surplus suggests that XOMA has a conservative balance sheet, and could probably eliminate its debt without much difficulty. Succinctly put, XOMA boasts net cash, so it's fair to say it does not have a heavy debt load! When analysing debt levels, the balance sheet is the obvious place to start. But it is future earnings, more than anything, that will determine XOMA's ability to maintain a healthy balance sheet going forward. So if you want to see what the professionals think, you might find this free report on analyst profit forecasts to be interesting.
Over 12 months, XOMA made a loss at the EBIT level, and saw its revenue drop to US$4.8m, which is a fall of 21%. That makes us nervous, to say the least.
So How Risky Is XOMA?
By their very nature companies that are losing money are more risky than those with a long history of profitability. And the fact is that over the last twelve months XOMA lost money at the earnings before interest and tax (EBIT) line. And over the same period it saw negative free cash outflow of US$4.2m and booked a US$46m accounting loss. But the saving grace is the US$29.4m on the balance sheet. That kitty means the company can keep spending for growth for at least two years, at current rates. Even though its balance sheet seems sufficiently liquid, debt always makes us a little nervous if a company doesn't produce free cash flow regularly. There's no doubt that we learn most about debt from the balance sheet. But ultimately, every company can contain risks that exist outside of the balance sheet. Case in point: We've spotted 2 warning signs for XOMA you should be aware of.
If you're interested in investing in businesses that can grow profits without the burden of debt, then check out this free list of growing businesses that have net cash on the balance sheet.
New: AI Stock Screener & Alerts
Our new AI Stock Screener scans the market every day to uncover opportunities.
• Dividend Powerhouses (3%+ Yield)
• Undervalued Small Caps with Insider Buying
• High growth Tech and AI Companies
Or build your own from over 50 metrics.
Have feedback on this article? Concerned about the content? Get in touch with us directly. Alternatively, email editorial-team (at) simplywallst.com.
This article by Simply Wall St is general in nature. We provide commentary based on historical data and analyst forecasts only using an unbiased methodology and our articles are not intended to be financial advice. It does not constitute a recommendation to buy or sell any stock, and does not take account of your objectives, or your financial situation. We aim to bring you long-term focused analysis driven by fundamental data. Note that our analysis may not factor in the latest price-sensitive company announcements or qualitative material. Simply Wall St has no position in any stocks mentioned.
About NasdaqGM:XOMA
XOMA Royalty
Operates as a biotech royalty aggregator in the United States and the Asia Pacific.
High growth potential with adequate balance sheet.
Market Insights


Advertisement
Community Narratives
America Wants Homegrown Drones — Draganfly Is Ready to Deliver
Fair Value US$9.21|27.4% undervalued
JO
Community Contributor
Cheesecake Factory offers an enticing opportunity for long-term growth by leveraging new concepts
Fair Value US$73.83|25.8% undervalued
ZW
Community Contributor
Coca-Cola’s Intrinsic Value Set to Rise with Fed Rate Cut
Fair Value US$67.50|2.7% undervalued
AL
Community Contributor
Fully Permitted Gold Mine with 50 Baggers Potential 
Fair Value CA$41.00|98.0% undervalued
RO
Community Contributor