- United States
- /
- Biotech
- /
- NasdaqGS:DNLI
An Intrinsic Calculation For Denali Therapeutics Inc. (NASDAQ:DNLI) Suggests It's 44% Undervalued


Key Insights
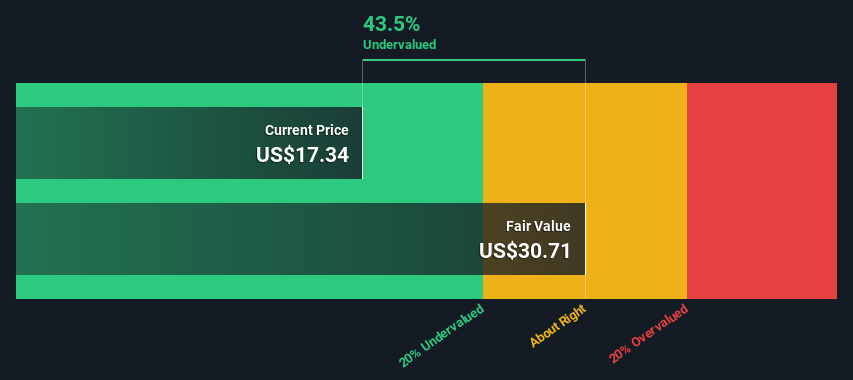
- Using the 2 Stage Free Cash Flow to Equity, Denali Therapeutics fair value estimate is US$30.71
- Denali Therapeutics' US$17.34 share price signals that it might be 44% undervalued
- Analyst price target for DNLI is US$40.27, which is 31% above our fair value estimate
Today we'll do a simple run through of a valuation method used to estimate the attractiveness of Denali Therapeutics Inc. (NASDAQ:DNLI) as an investment opportunity by taking the expected future cash flows and discounting them to their present value. We will take advantage of the Discounted Cash Flow (DCF) model for this purpose. There's really not all that much to it, even though it might appear quite complex.
Companies can be valued in a lot of ways, so we would point out that a DCF is not perfect for every situation. Anyone interested in learning a bit more about intrinsic value should have a read of the Simply Wall St analysis model.
View our latest analysis for Denali Therapeutics
Crunching The Numbers
We're using the 2-stage growth model, which simply means we take in account two stages of company's growth. In the initial period the company may have a higher growth rate and the second stage is usually assumed to have a stable growth rate. To start off with, we need to estimate the next ten years of cash flows. Where possible we use analyst estimates, but when these aren't available we extrapolate the previous free cash flow (FCF) from the last estimate or reported value. We assume companies with shrinking free cash flow will slow their rate of shrinkage, and that companies with growing free cash flow will see their growth rate slow, over this period. We do this to reflect that growth tends to slow more in the early years than it does in later years.
A DCF is all about the idea that a dollar in the future is less valuable than a dollar today, so we need to discount the sum of these future cash flows to arrive at a present value estimate:
10-year free cash flow (FCF) forecast
| 2024 | 2025 | 2026 | 2027 | 2028 | 2029 | 2030 | 2031 | 2032 | 2033 | |
| Levered FCF ($, Millions) | -US$356.1m | -US$375.9m | -US$245.5m | -US$169.8m | US$95.5m | US$141.0m | US$189.1m | US$235.6m | US$277.7m | US$314.4m |
| Growth Rate Estimate Source | Analyst x3 | Analyst x4 | Analyst x4 | Analyst x4 | Analyst x4 | Est @ 47.74% | Est @ 34.10% | Est @ 24.56% | Est @ 17.88% | Est @ 13.20% |
| Present Value ($, Millions) Discounted @ 6.1% | -US$336 | -US$334 | -US$205 | -US$134 | US$70.9 | US$98.7 | US$125 | US$146 | US$162 | US$173 |
("Est" = FCF growth rate estimated by Simply Wall St)
Present Value of 10-year Cash Flow (PVCF) = -US$232m
After calculating the present value of future cash flows in the initial 10-year period, we need to calculate the Terminal Value, which accounts for all future cash flows beyond the first stage. The Gordon Growth formula is used to calculate Terminal Value at a future annual growth rate equal to the 5-year average of the 10-year government bond yield of 2.3%. We discount the terminal cash flows to today's value at a cost of equity of 6.1%.
Terminal Value (TV)= FCF2033 × (1 + g) ÷ (r – g) = US$314m× (1 + 2.3%) ÷ (6.1%– 2.3%) = US$8.4b
Present Value of Terminal Value (PVTV)= TV / (1 + r)10= US$8.4b÷ ( 1 + 6.1%)10= US$4.6b
The total value, or equity value, is then the sum of the present value of the future cash flows, which in this case is US$4.4b. To get the intrinsic value per share, we divide this by the total number of shares outstanding. Relative to the current share price of US$17.3, the company appears quite undervalued at a 44% discount to where the stock price trades currently. The assumptions in any calculation have a big impact on the valuation, so it is better to view this as a rough estimate, not precise down to the last cent.
Important Assumptions
Now the most important inputs to a discounted cash flow are the discount rate, and of course, the actual cash flows. You don't have to agree with these inputs, I recommend redoing the calculations yourself and playing with them. The DCF also does not consider the possible cyclicality of an industry, or a company's future capital requirements, so it does not give a full picture of a company's potential performance. Given that we are looking at Denali Therapeutics as potential shareholders, the cost of equity is used as the discount rate, rather than the cost of capital (or weighted average cost of capital, WACC) which accounts for debt. In this calculation we've used 6.1%, which is based on a levered beta of 0.836. Beta is a measure of a stock's volatility, compared to the market as a whole. We get our beta from the industry average beta of globally comparable companies, with an imposed limit between 0.8 and 2.0, which is a reasonable range for a stable business.
SWOT Analysis for Denali Therapeutics
- Currently debt free.
- Shareholders have been diluted in the past year.
- Trading below our estimate of fair value by more than 20%.
- Has less than 3 years of cash runway based on current free cash flow.
- Not expected to become profitable over the next 3 years.
Looking Ahead:
Valuation is only one side of the coin in terms of building your investment thesis, and it is only one of many factors that you need to assess for a company. It's not possible to obtain a foolproof valuation with a DCF model. Instead the best use for a DCF model is to test certain assumptions and theories to see if they would lead to the company being undervalued or overvalued. If a company grows at a different rate, or if its cost of equity or risk free rate changes sharply, the output can look very different. Can we work out why the company is trading at a discount to intrinsic value? For Denali Therapeutics, we've compiled three relevant factors you should further examine:
- Risks: As an example, we've found 4 warning signs for Denali Therapeutics that you need to consider before investing here.
- Management:Have insiders been ramping up their shares to take advantage of the market's sentiment for DNLI's future outlook? Check out our management and board analysis with insights on CEO compensation and governance factors.
- Other Solid Businesses: Low debt, high returns on equity and good past performance are fundamental to a strong business. Why not explore our interactive list of stocks with solid business fundamentals to see if there are other companies you may not have considered!
PS. The Simply Wall St app conducts a discounted cash flow valuation for every stock on the NASDAQGS every day. If you want to find the calculation for other stocks just search here.
If you're looking to trade Denali Therapeutics, open an account with the lowest-cost platform trusted by professionals, Interactive Brokers.
With clients in over 200 countries and territories, and access to 160 markets, IBKR lets you trade stocks, options, futures, forex, bonds and funds from a single integrated account.
Enjoy no hidden fees, no account minimums, and FX conversion rates as low as 0.03%, far better than what most brokers offer.
Sponsored ContentNew: Manage All Your Stock Portfolios in One Place
We've created the ultimate portfolio companion for stock investors, and it's free.
• Connect an unlimited number of Portfolios and see your total in one currency
• Be alerted to new Warning Signs or Risks via email or mobile
• Track the Fair Value of your stocks
Have feedback on this article? Concerned about the content? Get in touch with us directly. Alternatively, email editorial-team (at) simplywallst.com.
This article by Simply Wall St is general in nature. We provide commentary based on historical data and analyst forecasts only using an unbiased methodology and our articles are not intended to be financial advice. It does not constitute a recommendation to buy or sell any stock, and does not take account of your objectives, or your financial situation. We aim to bring you long-term focused analysis driven by fundamental data. Note that our analysis may not factor in the latest price-sensitive company announcements or qualitative material. Simply Wall St has no position in any stocks mentioned.
About NasdaqGS:DNLI
Denali Therapeutics
A biopharmaceutical company, discovers and develops therapeutics to treat neurodegenerative and lysosomal storage diseases.
Flawless balance sheet with limited growth.
Market Insights

Community Narratives


