
Advertisement
- United States
- /
- Life Sciences
- /
- NasdaqGS:CDXS
Calculating The Intrinsic Value Of Codexis, Inc. (NASDAQ:CDXS)
Key Insights
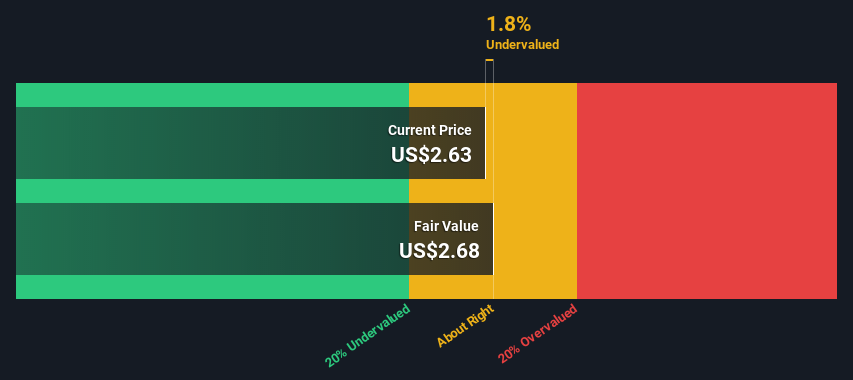
- Codexis' estimated fair value is US$2.68 based on 2 Stage Free Cash Flow to Equity
- With US$2.63 share price, Codexis appears to be trading close to its estimated fair value
- The US$11.14 analyst price target for CDXS is 316% more than our estimate of fair value
In this article we are going to estimate the intrinsic value of Codexis, Inc. (NASDAQ:CDXS) by taking the expected future cash flows and discounting them to their present value. The Discounted Cash Flow (DCF) model is the tool we will apply to do this. It may sound complicated, but actually it is quite simple!
Companies can be valued in a lot of ways, so we would point out that a DCF is not perfect for every situation. If you still have some burning questions about this type of valuation, take a look at the Simply Wall St analysis model.
See our latest analysis for Codexis
The Calculation
We use what is known as a 2-stage model, which simply means we have two different periods of growth rates for the company's cash flows. Generally the first stage is higher growth, and the second stage is a lower growth phase. To begin with, we have to get estimates of the next ten years of cash flows. Where possible we use analyst estimates, but when these aren't available we extrapolate the previous free cash flow (FCF) from the last estimate or reported value. We assume companies with shrinking free cash flow will slow their rate of shrinkage, and that companies with growing free cash flow will see their growth rate slow, over this period. We do this to reflect that growth tends to slow more in the early years than it does in later years.
A DCF is all about the idea that a dollar in the future is less valuable than a dollar today, and so the sum of these future cash flows is then discounted to today's value:
10-year free cash flow (FCF) forecast
| 2023 | 2024 | 2025 | 2026 | 2027 | 2028 | 2029 | 2030 | 2031 | 2032 | |
| Levered FCF ($, Millions) | -US$73.5m | -US$78.3m | -US$71.1m | -US$22.5m | US$11.5m | US$17.2m | US$23.3m | US$29.1m | US$34.5m | US$39.1m |
| Growth Rate Estimate Source | Analyst x1 | Analyst x1 | Analyst x1 | Analyst x1 | Analyst x1 | Est @ 49.23% | Est @ 35.10% | Est @ 25.20% | Est @ 18.27% | Est @ 13.42% |
| Present Value ($, Millions) Discounted @ 8.1% | -US$68.0 | -US$67.0 | -US$56.2 | -US$16.4 | US$7.8 | US$10.8 | US$13.5 | US$15.6 | US$17.1 | US$17.9 |
("Est" = FCF growth rate estimated by Simply Wall St)
Present Value of 10-year Cash Flow (PVCF) = -US$125m
After calculating the present value of future cash flows in the initial 10-year period, we need to calculate the Terminal Value, which accounts for all future cash flows beyond the first stage. The Gordon Growth formula is used to calculate Terminal Value at a future annual growth rate equal to the 5-year average of the 10-year government bond yield of 2.1%. We discount the terminal cash flows to today's value at a cost of equity of 8.1%.
Terminal Value (TV)= FCF2032 × (1 + g) ÷ (r – g) = US$39m× (1 + 2.1%) ÷ (8.1%– 2.1%) = US$664m
Present Value of Terminal Value (PVTV)= TV / (1 + r)10= US$664m÷ ( 1 + 8.1%)10= US$304m
The total value, or equity value, is then the sum of the present value of the future cash flows, which in this case is US$179m. In the final step we divide the equity value by the number of shares outstanding. Relative to the current share price of US$2.6, the company appears about fair value at a 1.8% discount to where the stock price trades currently. Valuations are imprecise instruments though, rather like a telescope - move a few degrees and end up in a different galaxy. Do keep this in mind.
Important Assumptions
We would point out that the most important inputs to a discounted cash flow are the discount rate and of course the actual cash flows. Part of investing is coming up with your own evaluation of a company's future performance, so try the calculation yourself and check your own assumptions. The DCF also does not consider the possible cyclicality of an industry, or a company's future capital requirements, so it does not give a full picture of a company's potential performance. Given that we are looking at Codexis as potential shareholders, the cost of equity is used as the discount rate, rather than the cost of capital (or weighted average cost of capital, WACC) which accounts for debt. In this calculation we've used 8.1%, which is based on a levered beta of 1.013. Beta is a measure of a stock's volatility, compared to the market as a whole. We get our beta from the industry average beta of globally comparable companies, with an imposed limit between 0.8 and 2.0, which is a reasonable range for a stable business.
SWOT Analysis for Codexis
Strength
- Currently debt free.
Weakness
- Shareholders have been diluted in the past year.
Opportunity
- Has sufficient cash runway for more than 3 years based on current free cash flows.
- Good value based on P/S ratio and estimated fair value.
Threat
- Not expected to become profitable over the next 3 years.
Looking Ahead:
Whilst important, the DCF calculation ideally won't be the sole piece of analysis you scrutinize for a company. The DCF model is not a perfect stock valuation tool. Instead the best use for a DCF model is to test certain assumptions and theories to see if they would lead to the company being undervalued or overvalued. If a company grows at a different rate, or if its cost of equity or risk free rate changes sharply, the output can look very different. For Codexis, we've compiled three pertinent aspects you should further research:
- Risks: Consider for instance, the ever-present spectre of investment risk. We've identified 3 warning signs with Codexis , and understanding them should be part of your investment process.
- Management:Have insiders been ramping up their shares to take advantage of the market's sentiment for CDXS's future outlook? Check out our management and board analysis with insights on CEO compensation and governance factors.
- Other High Quality Alternatives: Do you like a good all-rounder? Explore our interactive list of high quality stocks to get an idea of what else is out there you may be missing!
PS. The Simply Wall St app conducts a discounted cash flow valuation for every stock on the NASDAQGS every day. If you want to find the calculation for other stocks just search here.
New: AI Stock Screener & Alerts
Our new AI Stock Screener scans the market every day to uncover opportunities.
• Dividend Powerhouses (3%+ Yield)
• Undervalued Small Caps with Insider Buying
• High growth Tech and AI Companies
Or build your own from over 50 metrics.
Have feedback on this article? Concerned about the content? Get in touch with us directly. Alternatively, email editorial-team (at) simplywallst.com.
This article by Simply Wall St is general in nature. We provide commentary based on historical data and analyst forecasts only using an unbiased methodology and our articles are not intended to be financial advice. It does not constitute a recommendation to buy or sell any stock, and does not take account of your objectives, or your financial situation. We aim to bring you long-term focused analysis driven by fundamental data. Note that our analysis may not factor in the latest price-sensitive company announcements or qualitative material. Simply Wall St has no position in any stocks mentioned.
About NasdaqGS:CDXS
Codexis
Provides enzymatic solutions for therapeutics manufacturing, leveraging its proprietary CodeEvolver technology platform to discover, develop, and enhance novel enzymes in the United States, Canada, Latin America, Europe, the Middle East, Africa, Australia, New Zealand, Southeast Asia, and China.
Adequate balance sheet with low risk.
Similar Companies
Market Insights

Advertisement
Community Narratives
A formidable player in AI and enterprise computing.
Fair Value US$210.00|12.2% overvalued
CO
Community Contributor
IREN's Bold Moves in Sustainable Bitcoin Mining & AI Data Centers
Fair Value US$72.52|17.1% undervalued
BL
Community Contributor
Cooling the Champions: The Aussie Tech Behind F1's Victories
Fair Value AU$12.40|38.7% undervalued
TR
Community Contributor