- United States
- /
- Biotech
- /
- NasdaqCM:CAPR
Capricor Therapeutics, Inc.'s (NASDAQ:CAPR) 25% Dip In Price Shows Sentiment Is Matching Revenues


Capricor Therapeutics, Inc. (NASDAQ:CAPR) shares have retraced a considerable 25% in the last month, reversing a fair amount of their solid recent performance. The recent drop has obliterated the annual return, with the share price now down 4.7% over that longer period.
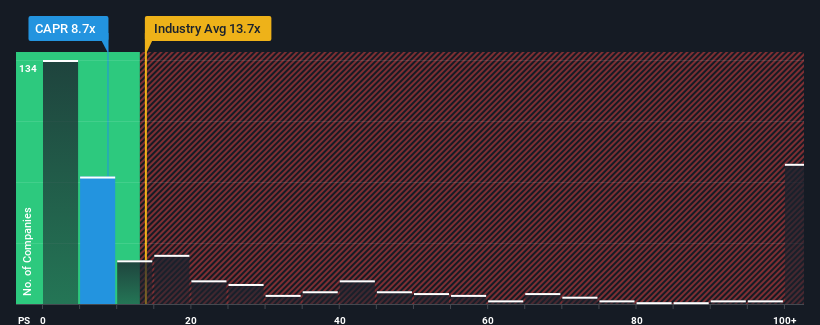
Since its price has dipped substantially, Capricor Therapeutics' price-to-sales (or "P/S") ratio of 8.7x might make it look like a buy right now compared to the Biotechs industry in the United States, where around half of the companies have P/S ratios above 13.7x and even P/S above 56x are quite common. Although, it's not wise to just take the P/S at face value as there may be an explanation why it's limited.
Check out our latest analysis for Capricor Therapeutics
What Does Capricor Therapeutics' Recent Performance Look Like?
Capricor Therapeutics certainly has been doing a good job lately as it's been growing revenue more than most other companies. One possibility is that the P/S ratio is low because investors think this strong revenue performance might be less impressive moving forward. If you like the company, you'd be hoping this isn't the case so that you could potentially pick up some stock while it's out of favour.
Keen to find out how analysts think Capricor Therapeutics' future stacks up against the industry? In that case, our free report is a great place to start.Is There Any Revenue Growth Forecasted For Capricor Therapeutics?
In order to justify its P/S ratio, Capricor Therapeutics would need to produce sluggish growth that's trailing the industry.
If we review the last year of revenue growth, we see the company's revenues grew exponentially. The latest three year period has also seen an incredible overall rise in revenue, aided by its incredible short-term performance. So we can start by confirming that the company has done a tremendous job of growing revenue over that time.
Turning to the outlook, the next three years should generate growth of 72% per annum as estimated by the three analysts watching the company. Meanwhile, the rest of the industry is forecast to expand by 226% per annum, which is noticeably more attractive.
With this information, we can see why Capricor Therapeutics is trading at a P/S lower than the industry. Apparently many shareholders weren't comfortable holding on while the company is potentially eyeing a less prosperous future.
The Bottom Line On Capricor Therapeutics' P/S
The southerly movements of Capricor Therapeutics' shares means its P/S is now sitting at a pretty low level. Using the price-to-sales ratio alone to determine if you should sell your stock isn't sensible, however it can be a practical guide to the company's future prospects.
As expected, our analysis of Capricor Therapeutics' analyst forecasts confirms that the company's underwhelming revenue outlook is a major contributor to its low P/S. At this stage investors feel the potential for an improvement in revenue isn't great enough to justify a higher P/S ratio. The company will need a change of fortune to justify the P/S rising higher in the future.
You should always think about risks. Case in point, we've spotted 2 warning signs for Capricor Therapeutics you should be aware of, and 1 of them is significant.
It's important to make sure you look for a great company, not just the first idea you come across. So if growing profitability aligns with your idea of a great company, take a peek at this free list of interesting companies with strong recent earnings growth (and a low P/E).
New: AI Stock Screener & Alerts
Our new AI Stock Screener scans the market every day to uncover opportunities.
• Dividend Powerhouses (3%+ Yield)
• Undervalued Small Caps with Insider Buying
• High growth Tech and AI Companies
Or build your own from over 50 metrics.
Have feedback on this article? Concerned about the content? Get in touch with us directly. Alternatively, email editorial-team (at) simplywallst.com.
This article by Simply Wall St is general in nature. We provide commentary based on historical data and analyst forecasts only using an unbiased methodology and our articles are not intended to be financial advice. It does not constitute a recommendation to buy or sell any stock, and does not take account of your objectives, or your financial situation. We aim to bring you long-term focused analysis driven by fundamental data. Note that our analysis may not factor in the latest price-sensitive company announcements or qualitative material. Simply Wall St has no position in any stocks mentioned.
About NasdaqCM:CAPR
Capricor Therapeutics
A clinical-stage biotechnology company, focuses on the development of transformative cell and exosome-based therapeutics for the treatment of duchenne muscular dystrophy (DMD) and other diseases with unmet medical needs.
Flawless balance sheet with high growth potential.
