

Warren Buffett famously said, 'Volatility is far from synonymous with risk.' So it seems the smart money knows that debt - which is usually involved in bankruptcies - is a very important factor, when you assess how risky a company is. Importantly, Innovid Corp. (NYSE:CTV) does carry debt. But the real question is whether this debt is making the company risky.
What Risk Does Debt Bring?
Debt assists a business until the business has trouble paying it off, either with new capital or with free cash flow. In the worst case scenario, a company can go bankrupt if it cannot pay its creditors. While that is not too common, we often do see indebted companies permanently diluting shareholders because lenders force them to raise capital at a distressed price. Of course, debt can be an important tool in businesses, particularly capital heavy businesses. The first step when considering a company's debt levels is to consider its cash and debt together.
See our latest analysis for Innovid
What Is Innovid's Debt?
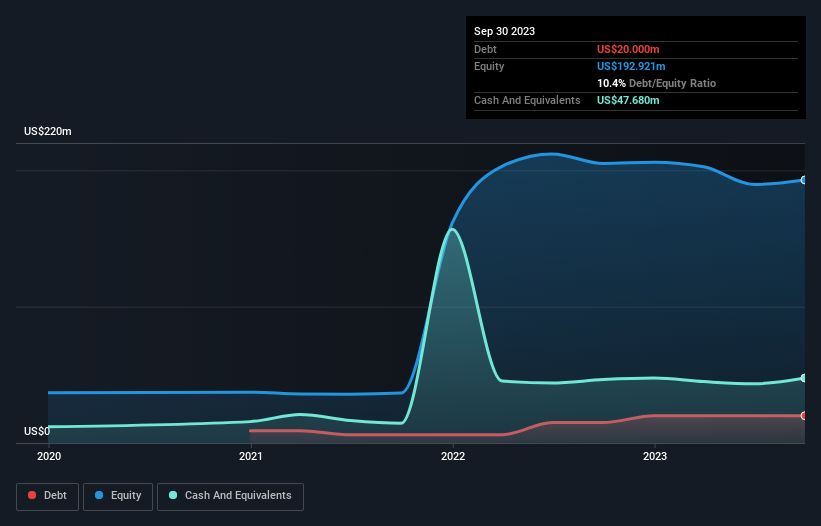
The image below, which you can click on for greater detail, shows that at September 2023 Innovid had debt of US$20.0m, up from US$15.0m in one year. But on the other hand it also has US$47.7m in cash, leading to a US$27.7m net cash position.
How Strong Is Innovid's Balance Sheet?
Zooming in on the latest balance sheet data, we can see that Innovid had liabilities of US$21.8m due within 12 months and liabilities of US$30.5m due beyond that. Offsetting these obligations, it had cash of US$47.7m as well as receivables valued at US$43.6m due within 12 months. So it actually has US$38.9m more liquid assets than total liabilities.
This surplus suggests that Innovid is using debt in a way that is appears to be both safe and conservative. Due to its strong net asset position, it is not likely to face issues with its lenders. Simply put, the fact that Innovid has more cash than debt is arguably a good indication that it can manage its debt safely. When analysing debt levels, the balance sheet is the obvious place to start. But it is future earnings, more than anything, that will determine Innovid's ability to maintain a healthy balance sheet going forward. So if you want to see what the professionals think, you might find this free report on analyst profit forecasts to be interesting.
Over 12 months, Innovid reported revenue of US$135m, which is a gain of 13%, although it did not report any earnings before interest and tax. That rate of growth is a bit slow for our taste, but it takes all types to make a world.
So How Risky Is Innovid?
We have no doubt that loss making companies are, in general, riskier than profitable ones. And the fact is that over the last twelve months Innovid lost money at the earnings before interest and tax (EBIT) line. Indeed, in that time it burnt through US$5.4m of cash and made a loss of US$34m. But the saving grace is the US$27.7m on the balance sheet. That means it could keep spending at its current rate for more than two years. Overall, its balance sheet doesn't seem overly risky, at the moment, but we're always cautious until we see the positive free cash flow. When analysing debt levels, the balance sheet is the obvious place to start. But ultimately, every company can contain risks that exist outside of the balance sheet. We've identified 2 warning signs with Innovid , and understanding them should be part of your investment process.
If you're interested in investing in businesses that can grow profits without the burden of debt, then check out this free list of growing businesses that have net cash on the balance sheet.
New: AI Stock Screener & Alerts
Our new AI Stock Screener scans the market every day to uncover opportunities.
• Dividend Powerhouses (3%+ Yield)
• Undervalued Small Caps with Insider Buying
• High growth Tech and AI Companies
Or build your own from over 50 metrics.
Have feedback on this article? Concerned about the content? Get in touch with us directly. Alternatively, email editorial-team (at) simplywallst.com.
This article by Simply Wall St is general in nature. We provide commentary based on historical data and analyst forecasts only using an unbiased methodology and our articles are not intended to be financial advice. It does not constitute a recommendation to buy or sell any stock, and does not take account of your objectives, or your financial situation. We aim to bring you long-term focused analysis driven by fundamental data. Note that our analysis may not factor in the latest price-sensitive company announcements or qualitative material. Simply Wall St has no position in any stocks mentioned.
About NYSE:CTV
Innovid
Operates an independent software platform that provides ad serving, measurement, and creative services.
Flawless balance sheet with reasonable growth potential.
Market Insights

Community Narratives


