Advertisement
- United States
- /
- Entertainment
- /
- NasdaqGS:ROKU
Where Does Roku Stand After the Latest NFL Sunday Ticket Partnership Announcement?

Simply Wall St
Reviewed by Bailey Pemberton
If you’re wondering what’s next for Roku stock, you’re not alone. With so much chatter about streaming competition and the ever-changing tech market, it’s natural to want clarity on where things stand. Over the last week, Roku shares dipped slightly by 1.4%, but then again, they’ve still managed a solid 5.0% advance in the past month. Year to date, the stock’s up a robust 32.3%, and when you look even further out—92.9% higher than three years ago—it’s clear Roku has powered through some big swings. Still, the riding isn’t always smooth: the five-year return sits at a surprising -55.8%, reflecting just how much the market’s perception of risk and opportunity has shifted for this company.
So, is Roku a bargain at $98.58 or is the market just warming up to new risks? To help us get to the bottom of this, let’s look at its value score, a quick indicator based on six separate valuation checks. Roku earns a 3 out of 6, suggesting that it's undervalued in exactly half the measures analysts typically watch. That’s neither screaming cheap nor wildly expensive, making it the kind of setup that brings out all sorts of opinions from investors and analysts alike.
In the next section, I’ll walk you through how this value score is built, and which valuation methods matter most for Roku right now. If you’re really hunting for the best way to judge Roku’s true worth, keep reading. I have a more insightful approach to share at the end of this article.
Why Roku is lagging behind its peers
Approach 1: Roku Discounted Cash Flow (DCF) Analysis
The Discounted Cash Flow (DCF) model estimates a company's value by projecting its future cash flows and discounting them back to today's dollar value. This method helps investors judge what a business is really worth, separate from the daily ups and downs of the stock market.
For Roku, the current Free Cash Flow stands at $318.94 Million. Analyst projections forecast strong growth in coming years, with Free Cash Flow expected to reach about $1.26 Billion by the end of 2029. While analysts provide detailed estimates for the next five years, future projections beyond that rely on extended extrapolations based on reasonable growth assumptions.
The DCF analysis results in an intrinsic value of $145.41 per share for Roku. When compared to its current share price of $98.58, this suggests the stock is trading at a significant 32.2% discount. In other words, Roku appears considerably undervalued by this measure and may offer a potential margin of safety for value-focused investors.
Result: UNDERVALUED
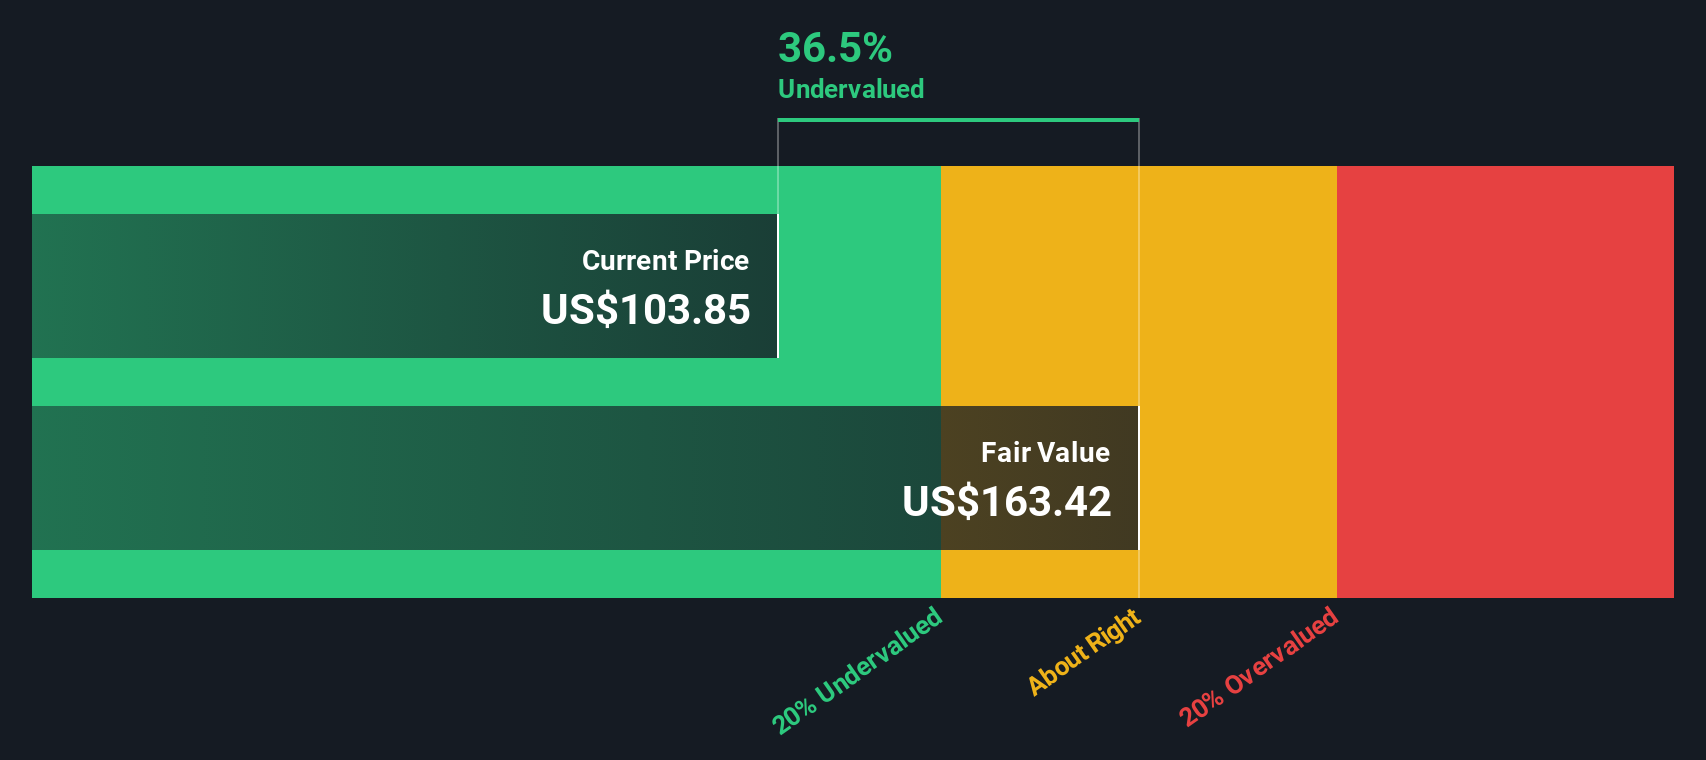
Our Discounted Cash Flow (DCF) analysis suggests Roku is undervalued by 32.2%. Track this in your watchlist or portfolio, or discover more undervalued stocks.
Approach 2: Roku Price vs Sales
For rapidly growing technology companies like Roku, the Price-to-Sales (P/S) ratio is often the most useful multiple for comparing valuations. This is because many such businesses are still scaling up and reinvesting profits, making traditional earnings-based ratios (like P/E) less informative or even unreliable when earnings are negative. The P/S ratio focuses on a company’s ability to generate revenues, which can provide a clearer lens for businesses prioritizing top-line growth.
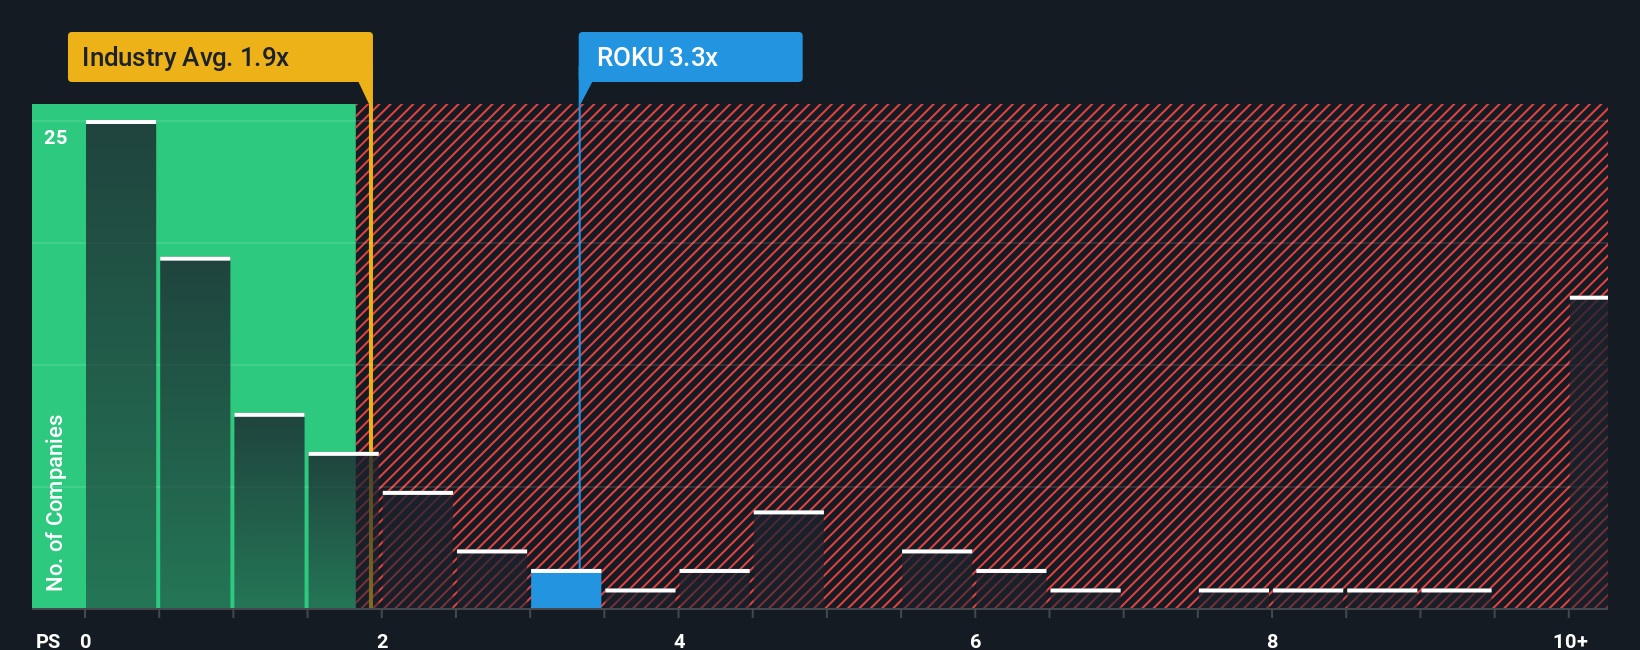
Growth expectations and risk play a significant role in what constitutes a “normal” or “fair” P/S ratio. Investors are typically willing to pay a higher multiple for strong sales growth, predictable sales trajectories, or lower risk. In Roku’s case, the current P/S ratio stands at 3.3x. This is below both the industry average of 1.76x and the peer average of 4.0x, suggesting Roku is valued more attractively than many of its direct competitors.
Simply Wall St’s proprietary Fair Ratio provides a more nuanced perspective than basic peer and industry comparisons. The Fair Ratio (2.57x for Roku) reflects multiple factors specific to the business, such as expected sales growth, profit margin, industry conditions, market capitalization, and unique risk profile. This approach captures the full context behind a company’s valuation, while industry benchmarks often overlook these critical differences.
By comparing Roku’s current P/S ratio of 3.3x to its Fair Ratio of 2.57x, Roku appears somewhat overvalued on this measure. While its multiple is attractive relative to peers, it is above what might be expected given its growth, margin, and risk factors.
Result: OVERVALUED
PS ratios tell one story, but what if the real opportunity lies elsewhere? Discover companies where insiders are betting big on explosive growth.
Upgrade Your Decision Making: Choose your Roku Narrative
Earlier we mentioned that there's an even better way to understand valuation. Let’s introduce you to Narratives. A Narrative is simply your story about a company: where you believe it’s headed, what challenges it faces, and what that means in dollar terms for its future fair value, revenue, earnings, and margins. Narratives connect the dots between what you know about Roku's industry evolution, your assumptions about its business performance, and a data-driven forecast that calculates an up-to-date fair value.
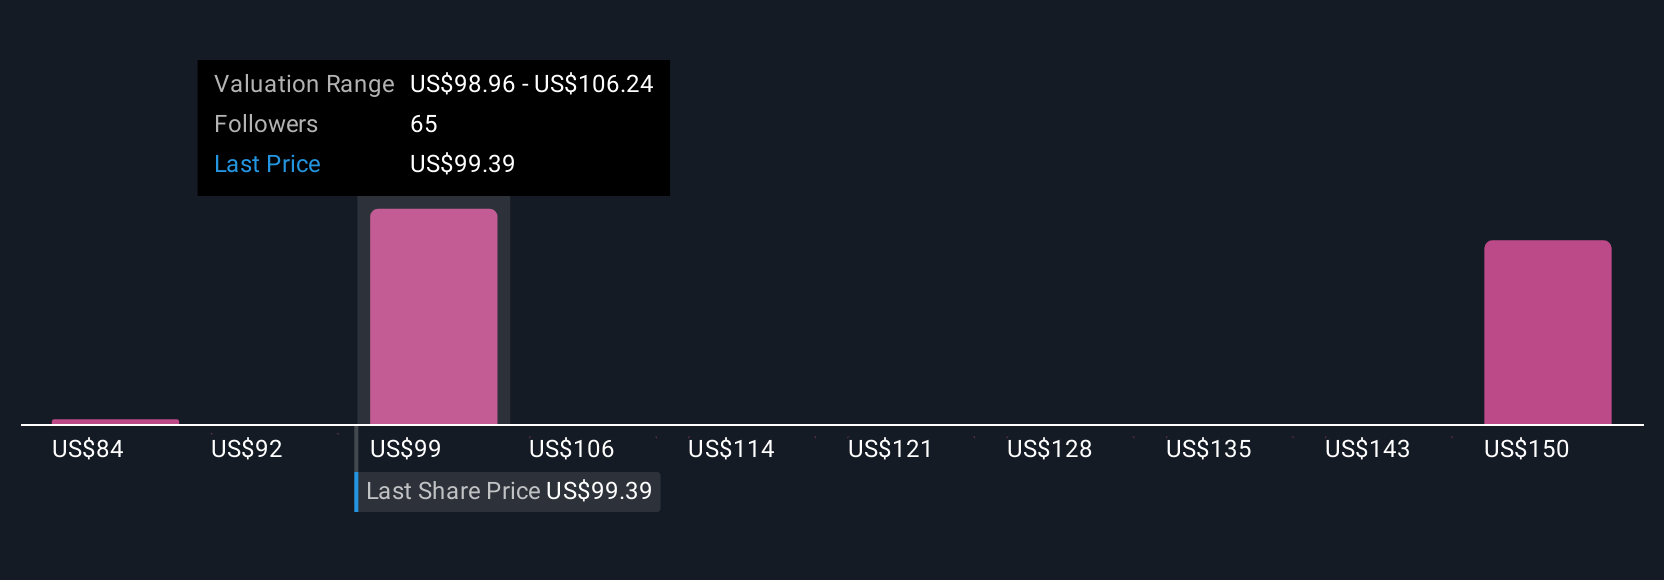
With Narratives on Simply Wall St’s Community page, millions of investors can quickly create, share, and update their own outlooks as new news or earnings arrive, making dynamic valuation easy and accessible. Narratives help you decide precisely when to buy or sell by updating Fair Value instantly compared to the current share price. For example, some investors see Roku’s global streaming expansion and new ad initiatives justifying a fair value as high as $130 per share, while others focus on risks from intense competition or ad market slowdowns, resulting in much lower targets, sometimes near $70. With Narratives, you can explore these perspectives, build your own, and make confident, personalized investment decisions as fresh information emerges.
Do you think there's more to the story for Roku? Create your own Narrative to let the Community know!
This article by Simply Wall St is general in nature. We provide commentary based on historical data and analyst forecasts only using an unbiased methodology and our articles are not intended to be financial advice. It does not constitute a recommendation to buy or sell any stock, and does not take account of your objectives, or your financial situation. We aim to bring you long-term focused analysis driven by fundamental data. Note that our analysis may not factor in the latest price-sensitive company announcements or qualitative material. Simply Wall St has no position in any stocks mentioned.
New: AI Stock Screener & Alerts
Our new AI Stock Screener scans the market every day to uncover opportunities.
• Dividend Powerhouses (3%+ Yield)
• Undervalued Small Caps with Insider Buying
• High growth Tech and AI Companies
Or build your own from over 50 metrics.
Have feedback on this article? Concerned about the content? Get in touch with us directly. Alternatively, email editorial-team@simplywallst.com
About NasdaqGS:ROKU
Roku
Operates a TV streaming platform in the United States and internationally.
Flawless balance sheet with reasonable growth potential.
Similar Companies
Market Insights

Advertisement
Community Narratives
A formidable player in AI and enterprise computing.
Fair Value US$210.00|13.6% overvalued
CO
Community Contributor
IREN's Bold Moves in Sustainable Bitcoin Mining & AI Data Centers
Fair Value US$89.00|23.6% undervalued
BL
Community Contributor
Cooling the Champions: The Aussie Tech Behind F1's Victories
Fair Value AU$12.40|40.6% undervalued
TR
Community Contributor