- United States
- /
- Media
- /
- NasdaqGS:NXST
Nexstar Media Group's (NASDAQ:NXST) five-year total shareholder returns outpace the underlying earnings growth


Nexstar Media Group, Inc. (NASDAQ:NXST) shareholders might be concerned after seeing the share price drop 14% in the last quarter. On the bright side the share price is up over the last half decade. However we are not very impressed because the share price is only up 61%, less than the market return of 94%.
In light of the stock dropping 8.4% in the past week, we want to investigate the longer term story, and see if fundamentals have been the driver of the company's positive five-year return.
See our latest analysis for Nexstar Media Group
To paraphrase Benjamin Graham: Over the short term the market is a voting machine, but over the long term it's a weighing machine. One imperfect but simple way to consider how the market perception of a company has shifted is to compare the change in the earnings per share (EPS) with the share price movement.
During five years of share price growth, Nexstar Media Group achieved compound earnings per share (EPS) growth of 10% per year. This EPS growth is remarkably close to the 10% average annual increase in the share price. This indicates that investor sentiment towards the company has not changed a great deal. Indeed, it would appear the share price is reacting to the EPS.
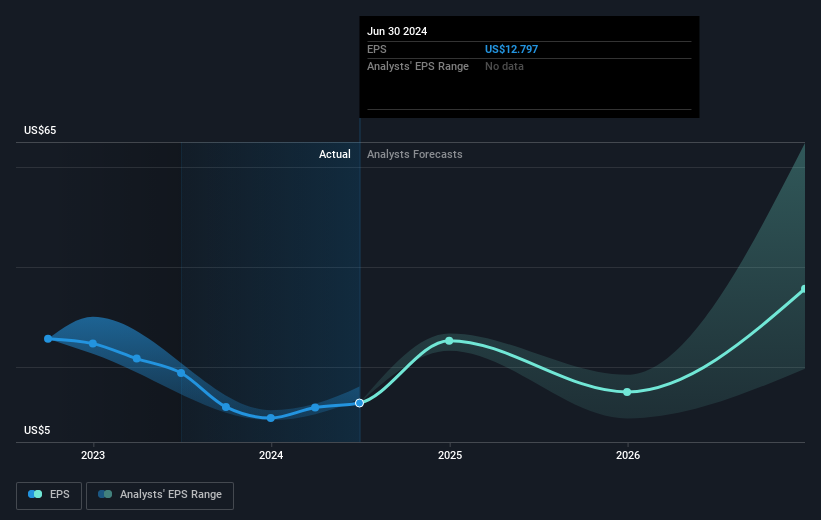
The company's earnings per share (over time) is depicted in the image below (click to see the exact numbers).
This free interactive report on Nexstar Media Group's earnings, revenue and cash flow is a great place to start, if you want to investigate the stock further.
What About Dividends?
As well as measuring the share price return, investors should also consider the total shareholder return (TSR). Whereas the share price return only reflects the change in the share price, the TSR includes the value of dividends (assuming they were reinvested) and the benefit of any discounted capital raising or spin-off. Arguably, the TSR gives a more comprehensive picture of the return generated by a stock. In the case of Nexstar Media Group, it has a TSR of 84% for the last 5 years. That exceeds its share price return that we previously mentioned. This is largely a result of its dividend payments!
A Different Perspective
While the broader market gained around 19% in the last year, Nexstar Media Group shareholders lost 0.9% (even including dividends). Even the share prices of good stocks drop sometimes, but we want to see improvements in the fundamental metrics of a business, before getting too interested. Longer term investors wouldn't be so upset, since they would have made 13%, each year, over five years. If the fundamental data continues to indicate long term sustainable growth, the current sell-off could be an opportunity worth considering. While it is well worth considering the different impacts that market conditions can have on the share price, there are other factors that are even more important. For example, we've discovered 2 warning signs for Nexstar Media Group (1 is a bit unpleasant!) that you should be aware of before investing here.
We will like Nexstar Media Group better if we see some big insider buys. While we wait, check out this free list of undervalued stocks (mostly small caps) with considerable, recent, insider buying.
Please note, the market returns quoted in this article reflect the market weighted average returns of stocks that currently trade on American exchanges.
Valuation is complex, but we're here to simplify it.
Discover if Nexstar Media Group might be undervalued or overvalued with our detailed analysis, featuring fair value estimates, potential risks, dividends, insider trades, and its financial condition.
Access Free AnalysisHave feedback on this article? Concerned about the content? Get in touch with us directly. Alternatively, email editorial-team (at) simplywallst.com.
This article by Simply Wall St is general in nature. We provide commentary based on historical data and analyst forecasts only using an unbiased methodology and our articles are not intended to be financial advice. It does not constitute a recommendation to buy or sell any stock, and does not take account of your objectives, or your financial situation. We aim to bring you long-term focused analysis driven by fundamental data. Note that our analysis may not factor in the latest price-sensitive company announcements or qualitative material. Simply Wall St has no position in any stocks mentioned.
About NasdaqGS:NXST
Nexstar Media Group
Operates as a diversified media company that produces and distributes engaging local and national news, sports and entertainment content across the television and digital platforms in the United States.
Undervalued established dividend payer.
