Advertisement
- United States
- /
- Media
- /
- NasdaqGS:CMCSA
Should Investors Rethink Comcast After NBCUniversal Layoffs and Stock Slump in 2025?

Simply Wall St
Reviewed by Bailey Pemberton
If you have been eyeing Comcast stock lately, you are not alone. With shares trading at $29.72 as of the last close, plenty of investors are weighing whether this is the time to buy, hold, or move on. After all, the price action has been tough to watch: down 3.4% over the last week, dropping 8.9% this past month, and falling a hefty 20.6% year-to-date. One-year returns stand at -27.0%, and the five-year stretch is also down 23.2%. But step back a bit and you will see that Comcast is still clinging to a positive 7.6% over a three-year window, which says something about its resilience in times of disruption.
Recent headlines have definitely contributed to the market’s unease. News of NBCUniversal layoffs and a major unit restructuring pushed risk perception higher, even as industry whispers circulate about Comcast potentially jumping into the ring for Warner Bros. Discovery. At the same time, partnerships like the one with Google for the LA28 Olympics spotlight how Comcast’s media properties keep finding new relevance.
So, with the stock battered and sentiment shaky, you are probably wondering whether all this turbulence means a bargain or a warning sign. According to our valuation scorecard, Comcast clocks in at an impressive 6 out of 6 for undervaluation. That means it passed every single check we use for relative and intrinsic value. But to really know what these checks mean and whether they tell the whole story, let’s dig into the details of how we get to this score. In addition, at the end, we will look at a valuation framework that might reveal even deeper insights.
Why Comcast is lagging behind its peers
Approach 1: Comcast Discounted Cash Flow (DCF) Analysis
The Discounted Cash Flow (DCF) model estimates a company's intrinsic value by forecasting its future cash flows and discounting them back to today's dollars. In Comcast's case, the model begins with current Free Cash Flow, which stands at $15.8 Billion. Analysts provide projections for the next several years, with Free Cash Flow expected to reach $16.1 Billion by 2029. Beyond five years, these figures are extrapolated based on long-term trends and assumptions, rather than direct analyst guidance.
By aggregating these anticipated cash flows and applying a discount rate, the DCF model arrives at an estimated fair value per share of $72.52. When compared to the current share price of $29.72, this suggests Comcast stock is trading at a 59.0% discount to its intrinsic value using this method. Such a wide gap implies the market is pricing in a high level of risk or uncertainty that may not be fully justified by the company’s future cash generation potential.
Result: UNDERVALUED
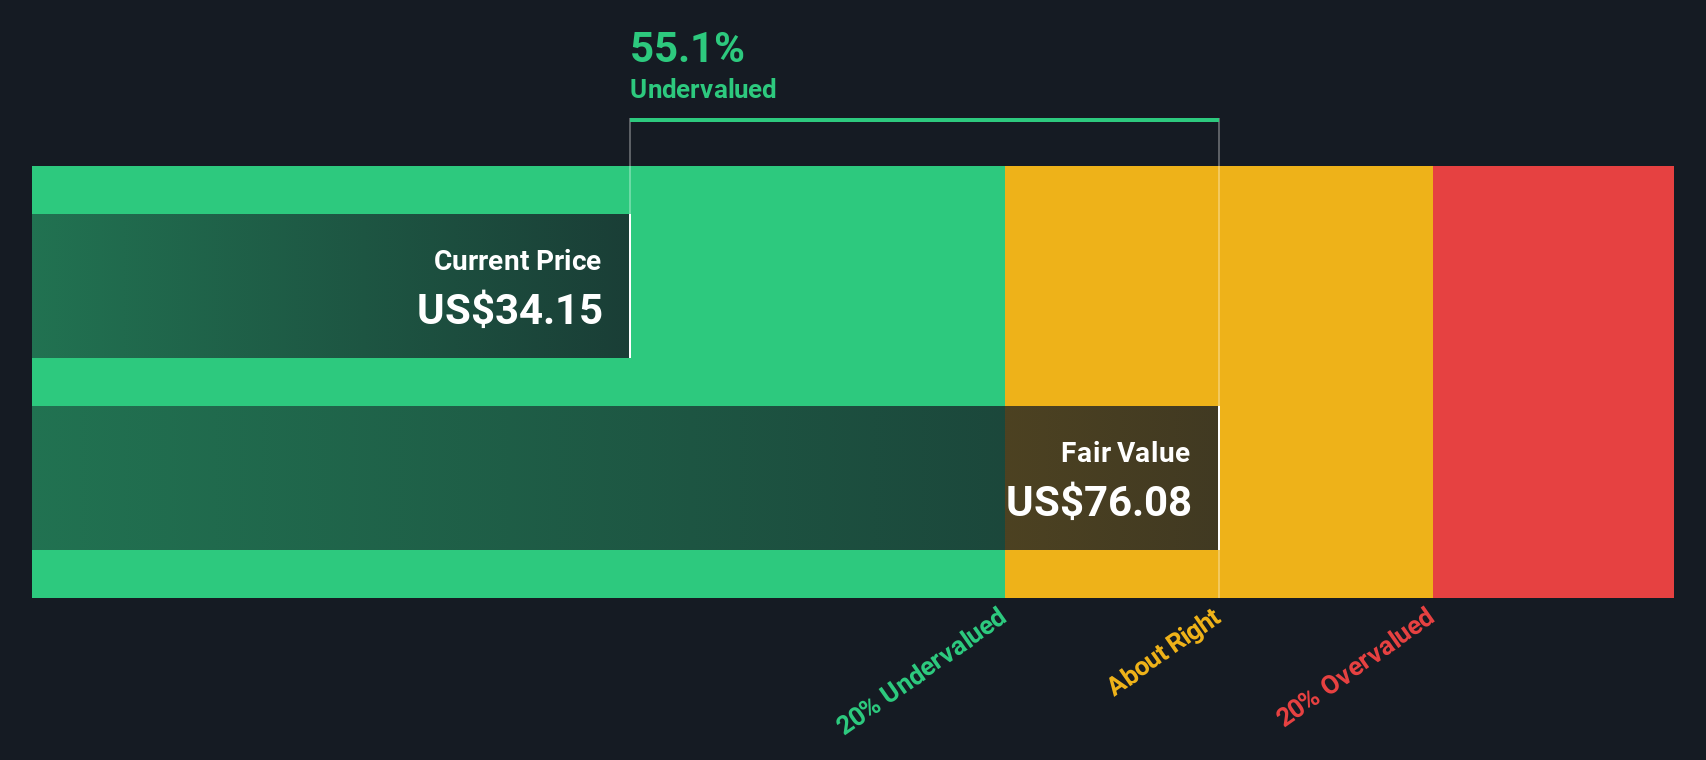
Our Discounted Cash Flow (DCF) analysis suggests Comcast is undervalued by 59.0%. Track this in your watchlist or portfolio, or discover more undervalued stocks.
Approach 2: Comcast Price vs Earnings (PE Ratio)
The Price-to-Earnings (PE) ratio is a widely used valuation metric for profitable companies like Comcast because it directly relates the company’s current share price to its earnings per share. This makes it a practical tool for investors to assess whether the stock is reasonably priced based on the company’s ability to generate profits. In general, higher growth expectations or lower risks justify a higher PE ratio, while lower growth or higher risks should result in a lower multiple.
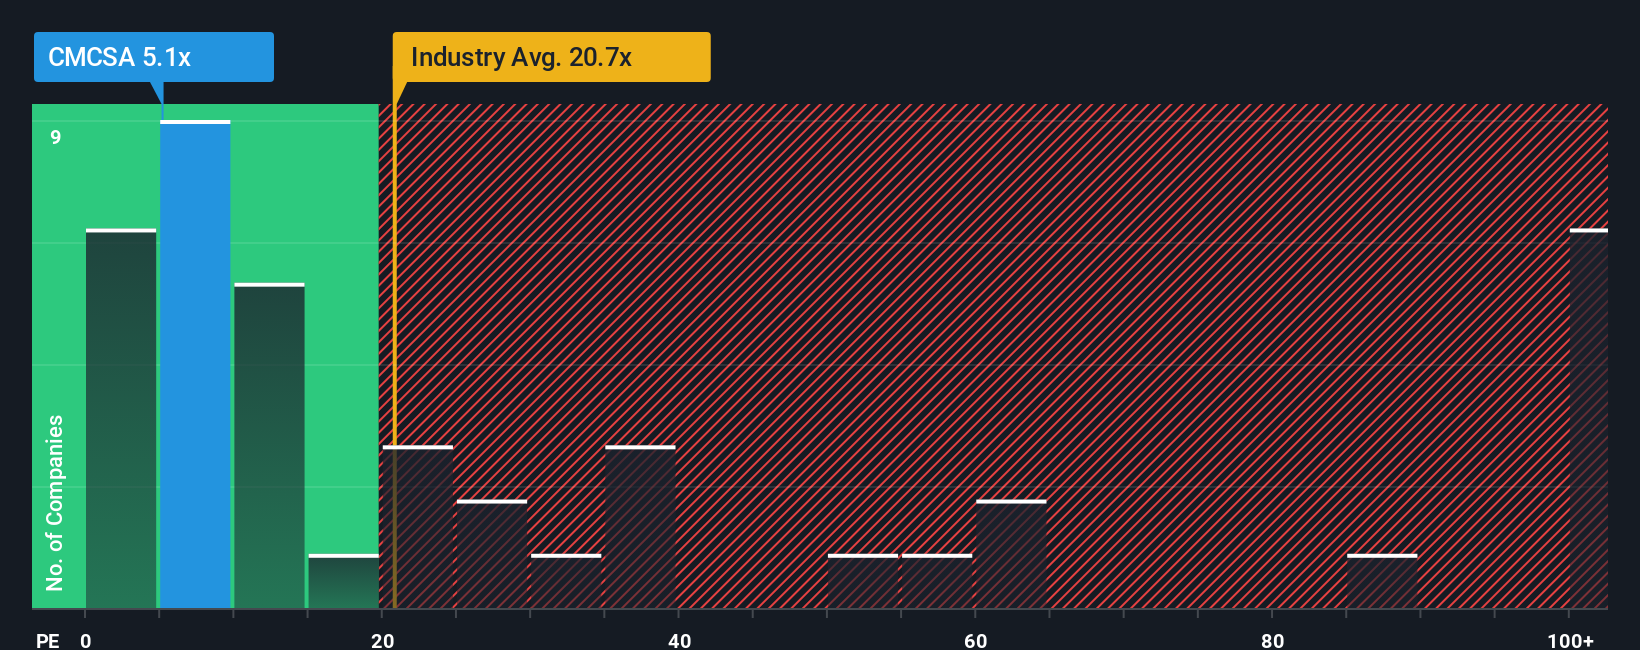
Currently, Comcast trades at a PE ratio of 4.8x. This is well below both the Media industry average of 19.2x and the broader peer group average of 44.9x. At first glance, this deep discount might look like the market is drastically underestimating Comcast’s potential, or it might reflect expectations of slower future growth or elevated risk.
To provide a more tailored benchmark, Simply Wall St offers a “Fair Ratio” for Comcast at 18.0x. This proprietary metric goes beyond surface-level comparisons by factoring in the company’s specific earnings growth projections, profit margins, risk profile, size within its industry, and market capitalization. Unlike basic peer or industry averages, the Fair Ratio puts Comcast’s valuation into better context and gives investors a nuanced yardstick that adjusts for what really makes the company unique.
When you compare the Fair Ratio (18.0x) to Comcast’s actual PE ratio (4.8x), it is clear the stock is significantly undervalued by this measure.
Result: UNDERVALUED
PE ratios tell one story, but what if the real opportunity lies elsewhere? Discover companies where insiders are betting big on explosive growth.
Upgrade Your Decision Making: Choose your Comcast Narrative
Earlier we mentioned that there is an even better way to understand valuation, so let us introduce you to Narratives. A Narrative is more than just a number; it is your perspective on where a company is headed, grounded in your own assumptions about its fair value, estimated future revenue, earnings, and profit margins. Narratives help you connect the company’s story to a financial forecast, and then translate that directly into a fair value estimate, making investment judgments more purposeful and personal.
Narratives are easy and accessible for everyone on Simply Wall St’s Community page, used by millions of investors to share, compare, and debate their stories behind the numbers. They enable you to see in one place how your forecasted business outlook translates into a valuation, allowing you to compare the resulting fair value with the current market price. This helps you decide when to buy or sell based on logic, not just emotion.
Best of all, Narratives automatically update as new news or earnings reports come in, so your investment view is always current. For example, some investors currently estimate Comcast’s fair value as high as about $49.43 (optimistic about broadband, streaming, and parks growth), while others are as low as $31.00 (more focused on rising costs and competitive threats). Which Narrative fits your outlook?
Do you think there's more to the story for Comcast? Create your own Narrative to let the Community know!

This article by Simply Wall St is general in nature. We provide commentary based on historical data and analyst forecasts only using an unbiased methodology and our articles are not intended to be financial advice. It does not constitute a recommendation to buy or sell any stock, and does not take account of your objectives, or your financial situation. We aim to bring you long-term focused analysis driven by fundamental data. Note that our analysis may not factor in the latest price-sensitive company announcements or qualitative material. Simply Wall St has no position in any stocks mentioned.
New: AI Stock Screener & Alerts
Our new AI Stock Screener scans the market every day to uncover opportunities.
• Dividend Powerhouses (3%+ Yield)
• Undervalued Small Caps with Insider Buying
• High growth Tech and AI Companies
Or build your own from over 50 metrics.
Have feedback on this article? Concerned about the content? Get in touch with us directly. Alternatively, email editorial-team@simplywallst.com
About NasdaqGS:CMCSA
Very undervalued with solid track record and pays a dividend.
Similar Companies
Market Insights

Advertisement
Community Narratives
A formidable player in AI and enterprise computing.
Fair Value US$210.00|13.6% overvalued
CO
Community Contributor
IREN's Bold Moves in Sustainable Bitcoin Mining & AI Data Centers
Fair Value US$89.00|23.6% undervalued
BL
Community Contributor
Cooling the Champions: The Aussie Tech Behind F1's Victories
Fair Value AU$12.40|37.6% undervalued
TR
Community Contributor