- United States
- /
- Media
- /
- NasdaqGS:CMCSA
Investors in Comcast (NASDAQ:CMCSA) have unfortunately lost 24% over the last three years


In order to justify the effort of selecting individual stocks, it's worth striving to beat the returns from a market index fund. But the risk of stock picking is that you will likely buy under-performing companies. Unfortunately, that's been the case for longer term Comcast Corporation (NASDAQ:CMCSA) shareholders, since the share price is down 30% in the last three years, falling well short of the market return of around 23%.
Since shareholders are down over the longer term, lets look at the underlying fundamentals over the that time and see if they've been consistent with returns.
Check out our latest analysis for Comcast
There is no denying that markets are sometimes efficient, but prices do not always reflect underlying business performance. One imperfect but simple way to consider how the market perception of a company has shifted is to compare the change in the earnings per share (EPS) with the share price movement.
During the unfortunate three years of share price decline, Comcast actually saw its earnings per share (EPS) improve by 13% per year. This is quite a puzzle, and suggests there might be something temporarily buoying the share price. Alternatively, growth expectations may have been unreasonable in the past.
Since the change in EPS doesn't seem to correlate with the change in share price, it's worth taking a look at other metrics.
The company has kept revenue pretty healthy over the last three years, so we doubt that explains the falling share price. We're not entirely sure why the share price is dropped, but it does seem likely investors have become less optimistic about the business.
The graphic below depicts how earnings and revenue have changed over time (unveil the exact values by clicking on the image).
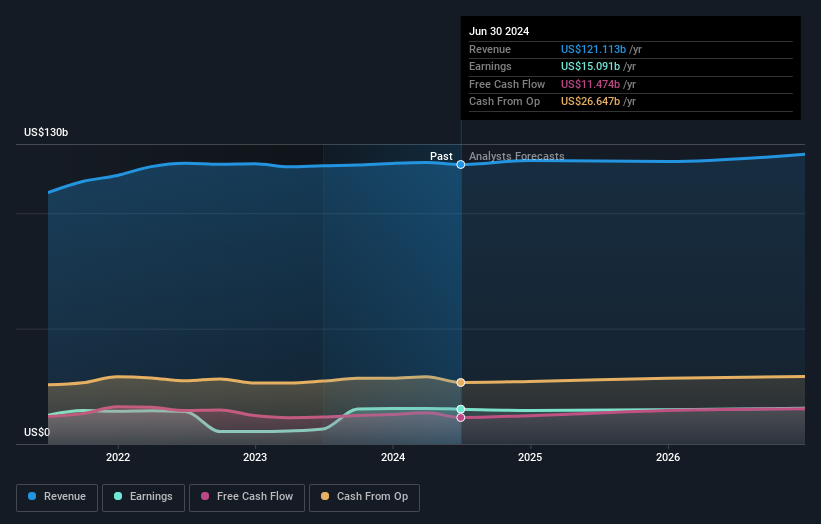
Comcast is well known by investors, and plenty of clever analysts have tried to predict the future profit levels. So it makes a lot of sense to check out what analysts think Comcast will earn in the future (free analyst consensus estimates)
What About Dividends?
When looking at investment returns, it is important to consider the difference between total shareholder return (TSR) and share price return. The TSR is a return calculation that accounts for the value of cash dividends (assuming that any dividend received was reinvested) and the calculated value of any discounted capital raisings and spin-offs. So for companies that pay a generous dividend, the TSR is often a lot higher than the share price return. As it happens, Comcast's TSR for the last 3 years was -24%, which exceeds the share price return mentioned earlier. This is largely a result of its dividend payments!
A Different Perspective
Comcast shareholders are down 11% for the year (even including dividends), but the market itself is up 27%. However, keep in mind that even the best stocks will sometimes underperform the market over a twelve month period. Regrettably, last year's performance caps off a bad run, with the shareholders facing a total loss of 0.5% per year over five years. Generally speaking long term share price weakness can be a bad sign, though contrarian investors might want to research the stock in hope of a turnaround. I find it very interesting to look at share price over the long term as a proxy for business performance. But to truly gain insight, we need to consider other information, too. To that end, you should be aware of the 1 warning sign we've spotted with Comcast .
We will like Comcast better if we see some big insider buys. While we wait, check out this free list of undervalued stocks (mostly small caps) with considerable, recent, insider buying.
Please note, the market returns quoted in this article reflect the market weighted average returns of stocks that currently trade on American exchanges.
New: AI Stock Screener & Alerts
Our new AI Stock Screener scans the market every day to uncover opportunities.
• Dividend Powerhouses (3%+ Yield)
• Undervalued Small Caps with Insider Buying
• High growth Tech and AI Companies
Or build your own from over 50 metrics.
Have feedback on this article? Concerned about the content? Get in touch with us directly. Alternatively, email editorial-team (at) simplywallst.com.
This article by Simply Wall St is general in nature. We provide commentary based on historical data and analyst forecasts only using an unbiased methodology and our articles are not intended to be financial advice. It does not constitute a recommendation to buy or sell any stock, and does not take account of your objectives, or your financial situation. We aim to bring you long-term focused analysis driven by fundamental data. Note that our analysis may not factor in the latest price-sensitive company announcements or qualitative material. Simply Wall St has no position in any stocks mentioned.
About NasdaqGS:CMCSA
Undervalued established dividend payer.

