Advertisement
- United States
- /
- Chemicals
- /
- NYSE:OLN
Is Olin (OLN) Pricing Reflect A 60% Three Year Fall And DCF Upside Potential

Reviewed by Bailey Pemberton
- If you are wondering whether Olin's current share price lines up with its underlying value, this article will walk through what the numbers are really saying about the stock.
- Olin's share price closed at US$23.60 most recently, with returns of 0.8% over 7 days, 13.0% over 30 days, 9.5% year to date, a 26.2% decline over 1 year and a 59.8% decline over 3 years, while the 5 year return sits close to flat at a 0.6% decline.
- Recent moves in the stock have been accompanied by ongoing investor interest in how Olin is positioned in the materials sector, including its exposure to key chemicals end markets and broader sentiment toward cyclical names. These themes help frame how investors interpret both the shorter term gains and the longer term share price declines shown in the return numbers.
- On Simply Wall St's valuation checks, Olin currently scores 2 out of 6. Next, we will look at what different valuation approaches say about that score, as well as a way of thinking about valuation that can give you an even clearer picture by the end of the article.
Olin scores just 2/6 on our valuation checks. See what other red flags we found in the full valuation breakdown.
Approach 1: Olin Discounted Cash Flow (DCF) Analysis
A DCF model takes estimates of a company’s future cash flows, then discounts them back to today’s dollars to arrive at an estimate of what the business might be worth right now.
For Olin, the model used is a 2 Stage Free Cash Flow to Equity approach, based on projected free cash flows in $. The latest twelve month free cash flow is about $21.47 million. Analyst inputs extend out to 2028, with Simply Wall St extrapolating further to build a ten year path. By 2035, the model is using a projected free cash flow of about $1.28 billion, with each year’s cash flow discounted back to today.
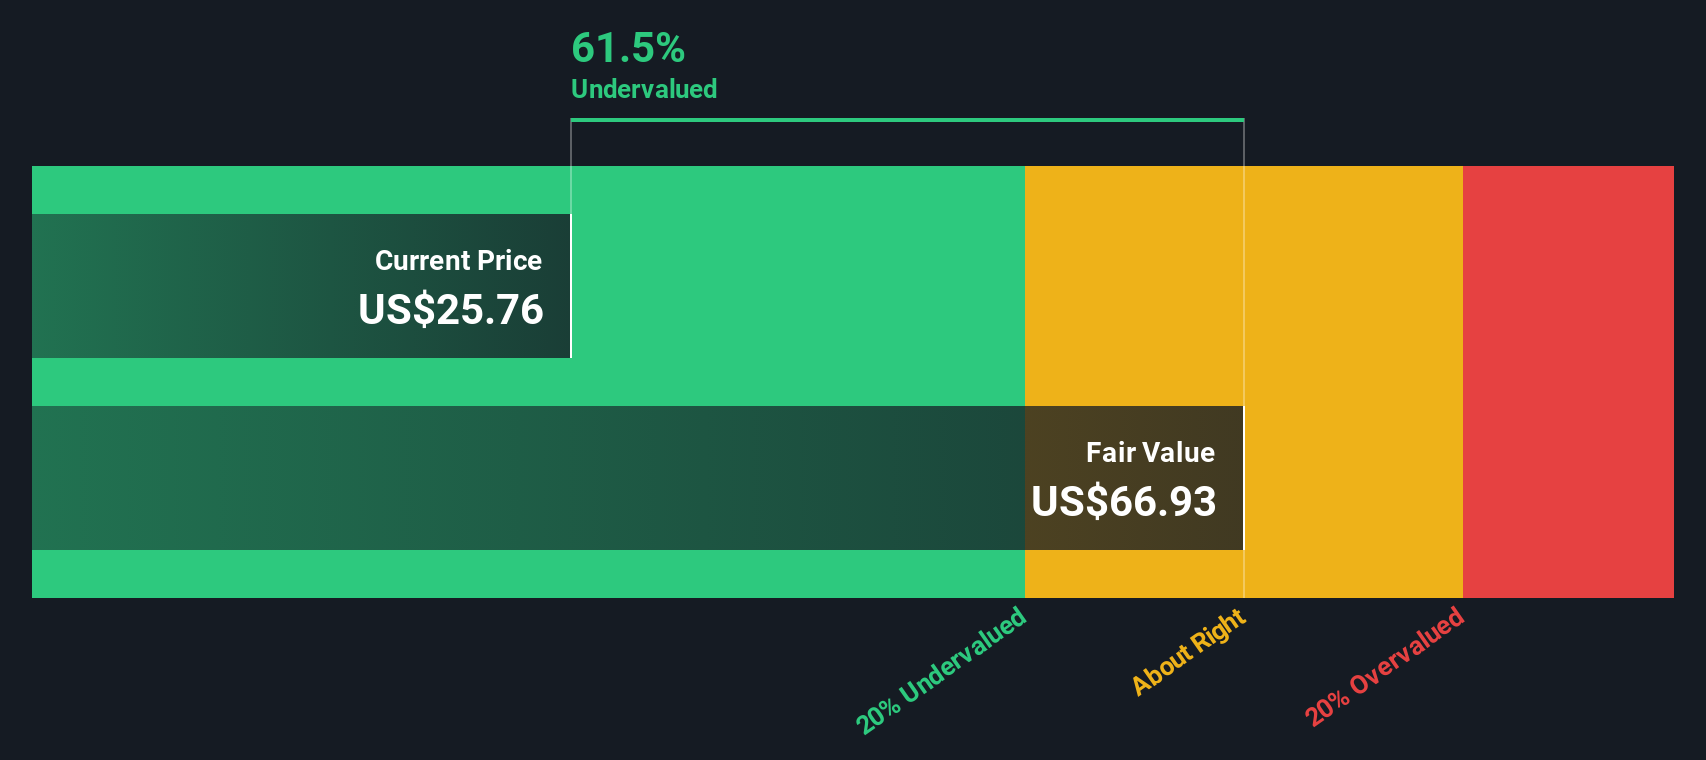
Adding those discounted cash flows together gives an estimated intrinsic value of about $108.89 per share. Compared with the recent share price of $23.60, the model implies an intrinsic discount of 78.3%, which indicates that Olin is trading well below this DCF estimate.
Result: UNDERVALUED
Our Discounted Cash Flow (DCF) analysis suggests Olin is undervalued by 78.3%. Track this in your watchlist or portfolio, or discover 887 more undervalued stocks based on cash flows.
Approach 2: Olin Price vs Earnings
For a profitable company, the P/E ratio is a helpful way to think about what you are paying for each dollar of earnings, because it connects directly to the business’s ability to generate profit today.
In general, higher growth expectations and lower perceived risk tend to support a higher P/E ratio. Slower growth prospects or greater uncertainty usually line up with a lower, more conservative P/E that investors might see as normal.
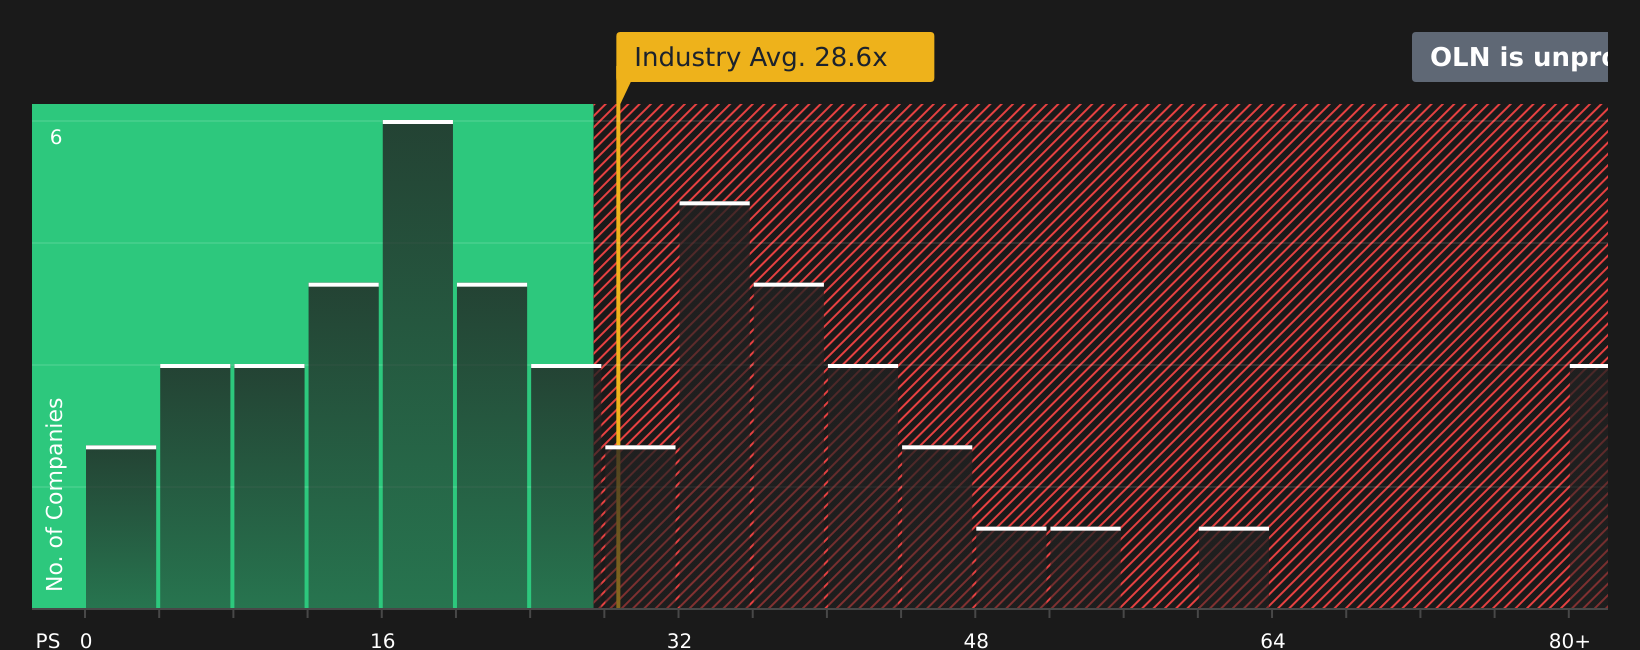
Olin currently trades on a P/E of 50.25x. That sits above the Chemicals industry average of about 25.51x and the peer average of about 25.17x, so on simple comparisons the shares look expensive relative to many peers.
Simply Wall St’s Fair Ratio for Olin is 37.90x. This is a proprietary estimate of what a reasonable P/E might look like after considering factors such as earnings growth, profit margins, industry, market cap and company specific risks. Because it is tailored to Olin rather than being a blunt average, it can give a more company specific read than industry or peer P/E comparisons alone.
Set against this Fair Ratio, Olin’s current P/E of 50.25x screens as higher than what the model suggests is justified.
Result: OVERVALUED
P/E ratios tell one story, but what if the real opportunity lies elsewhere? Discover 1424 companies where insiders are betting big on explosive growth.
Upgrade Your Decision Making: Choose your Olin Narrative
Earlier we mentioned that there is an even better way to understand valuation, so let us introduce Narratives, which let you attach a clear story about Olin to the numbers behind your own fair value, including your assumptions for future revenue, earnings and margins.
A Narrative links three things in one place: the company story you believe, the financial forecast that flows from that story, and the fair value estimate that drops out of those forecasts.
You can build and compare Narratives on Simply Wall St’s Community page, where millions of investors share their views and you can see how each story translates into a Fair Value that you can set against today’s share price to help decide whether Olin looks attractive or not for you.
Narratives update automatically as new information such as news or earnings is added, so your fair value view stays current rather than frozen. You can quickly see, for example, one Olin Narrative that assumes strong recovery and assigns a very high fair value, while another assumes more modest prospects and assigns a much lower fair value.
Do you think there's more to the story for Olin? Head over to our Community to see what others are saying!

This article by Simply Wall St is general in nature. We provide commentary based on historical data and analyst forecasts only using an unbiased methodology and our articles are not intended to be financial advice. It does not constitute a recommendation to buy or sell any stock, and does not take account of your objectives, or your financial situation. We aim to bring you long-term focused analysis driven by fundamental data. Note that our analysis may not factor in the latest price-sensitive company announcements or qualitative material. Simply Wall St has no position in any stocks mentioned.
New: AI Stock Screener & Alerts
Our new AI Stock Screener scans the market every day to uncover opportunities.
• Dividend Powerhouses (3%+ Yield)
• Undervalued Small Caps with Insider Buying
• High growth Tech and AI Companies
Or build your own from over 50 metrics.
Have feedback on this article? Concerned about the content? Get in touch with us directly. Alternatively, email editorial-team@simplywallst.com
About NYSE:OLN
Olin
Manufactures and distributes chemical products in the United States, Europe, Asia Pacific, the Middle East, Africa, and India Middle East, Africa, India, Latin America, and Canada.
Very undervalued with moderate growth potential.
Similar Companies
Market Insights


Advertisement
Weekly Picks
LO


Lou_Basenese on Virtuix Holdings ·
From a “Shark Tank” Snub to an Air Force “Yes”: Why Virtuix at $3.50 May Be the Market’s Most Mispriced AI Story
Fair Value:US$7.562.8% undervalued
22 followersusers have followed this narrative
0 commentsusers have commented on this narrative
3 likesusers have liked this narrative
IN


Investingwilly on Mastercard ·
Mastercard: The Best Dividend Stock You're Ignoring
Fair Value:US$75033.5% undervalued
71 followersusers have followed this narrative
1 commentusers have commented on this narrative
9 likesusers have liked this narrative
TR


tripledub on Intuit ·
A Wonderful Business at a Not-So-Wonderful Price
Fair Value:US$56052.2% undervalued
64 followersusers have followed this narrative
4 commentsusers have commented on this narrative
30 likesusers have liked this narrative
TA


Talos on MindWalk Holdings ·
The Asymmetric TechBio Play: MindWalk Holdings and the Valuation Disconnect
Fair Value:US$8.2780.9% undervalued
35 followersusers have followed this narrative
0 commentsusers have commented on this narrative
9 likesusers have liked this narrative
Recently Updated Narratives
RO


RockeTeller on Orezone Gold ·
Orezone Gold Could 3X–5X, Bomboré Ramp + Casa Berardi Quebec Asset Delivers 160-180Koz in 2026
Fair Value:CA$10.6878.4% undervalued
11 followersusers have followed this narrative
4 commentsusers have commented on this narrative
1 likeusers have liked this narrative
IV

Ivoed on Netflix ·
Netflix’s Business Quality Is Clear. The Harder Question Is Whether The Stock Is Still Cheap
Fair Value:US$8210.0% undervalued
3 followersusers have followed this narrative
0 commentsusers have commented on this narrative
0 likesusers have liked this narrative
RO

RockeTeller on NeXGold Mining ·
NexGold Mining: 4.7Moz M&I Resources, $100M Cash + Debt-Free, Construction Decision 2026 Undervalued Canadian Gold Developer
Fair Value:CA$39.5296.9% undervalued
5 followersusers have followed this narrative
3 commentsusers have commented on this narrative
1 likeusers have liked this narrative
Popular Narratives
IN
Investingwilly on Mastercard ·
Mastercard: The Best Dividend Stock You're Ignoring
Fair Value:US$75033.5% undervalued
71 followersusers have followed this narrative
1 commentusers have commented on this narrative
9 likesusers have liked this narrative
HA


HarishPK on Adobe ·
Adobe: A Probabilistic Case for Undervaluation
Fair Value:US$319.9636.6% undervalued
62 followersusers have followed this narrative
9 commentsusers have commented on this narrative
19 likesusers have liked this narrative
MA


martinarauz on Nu Holdings ·
Investment Analysis (May 2026)
Fair Value:US$22.7442.1% undervalued
68 followersusers have followed this narrative
0 commentsusers have commented on this narrative
17 likesusers have liked this narrative
