Advertisement
- United States
- /
- Chemicals
- /
- NYSE:OLN
Does Olin’s Recent Stock Rally Signal Real Value After a Tough Year?

Simply Wall St
Reviewed by Bailey Pemberton
If you own Olin or are considering whether it deserves a spot in your portfolio, you’re definitely not alone in weighing your options right now. Olin’s stock has had a turbulent ride lately, and some investors are starting to see more opportunity than risk on the horizon. Over the past week, the stock notched a 6.1% gain, bouncing back from some pretty harsh dips earlier this year. Zoom out just a bit, and you’ll notice the picture is more complex: Olin has lagged the broader market in 2024 so far, down 22.6% year-to-date, and over the last year the stock is off by a significant 44.3%. If you’re someone who looks for long-term resilience, the five-year return stands at a solid 82.4%, reminding us that tough periods can sometimes set the stage for bigger comebacks.
Much of the recent volatility reflects shifting sentiment after sector-wide shakeups and evolving chemical industry demand. Investors have been recalibrating risk, occasionally stepping back in such cycles. Still, a close look at Olin’s current valuation score—5 out of a possible 6 undervalued metrics—suggests the company might actually be getting overlooked where it counts most: value. But are these surface-level valuation checks enough to reveal Olin’s true potential?
Let’s break down the main valuation methods investors use to gauge whether a stock like Olin is truly undervalued, and later, we’ll show you an even smarter angle that cuts through the noise.
Why Olin is lagging behind its peers
Approach 1: Olin Discounted Cash Flow (DCF) Analysis
The Discounted Cash Flow (DCF) model estimates a company’s true value by projecting its future cash flows and then discounting them back to today’s dollars. This approach provides insight into what a business might really be worth based on the cash it can generate, rather than relying solely on market sentiment or earnings ratios.
For Olin, recent figures show it generated Free Cash Flow (FCF) of $199.5 million over the latest twelve months. Analyst forecasts indicate this cash flow is expected to grow, with projections of $357.6 million by 2026 and $422.5 million by 2027. Looking further ahead, Simply Wall St extrapolates estimates up to 2035, with discounted cash flows expected to remain robust year after year. All figures are in US dollars, and these projections are based on the chemical industry’s recovery and Olin’s operational strengths.
According to the model, Olin’s DCF-based intrinsic value is calculated at $66.93 per share, which suggests the stock trades at a 61.3 percent discount relative to this estimated fair value. In other words, the DCF model presents a view of considerable undervaluation at current prices.
Result: UNDERVALUED
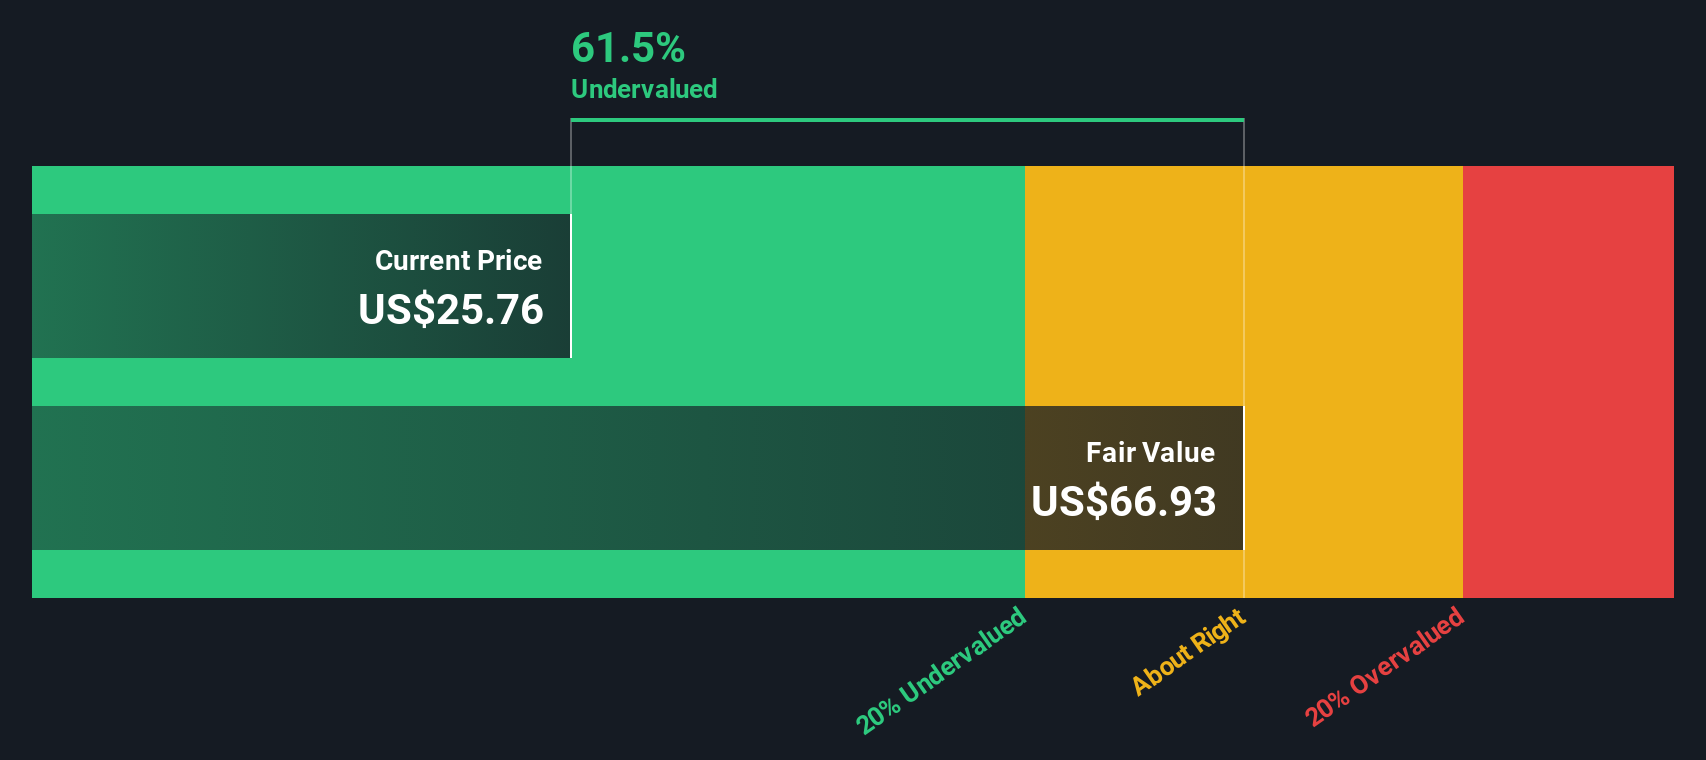
Our Discounted Cash Flow (DCF) analysis suggests Olin is undervalued by 61.3%. Track this in your watchlist or portfolio, or discover more undervalued stocks.
Approach 2: Olin Price vs Sales
The Price-to-Sales (P/S) ratio is often considered a reliable valuation metric, especially for companies where earnings fluctuate or may currently be negative. For businesses like Olin, in the chemicals sector, the P/S ratio allows investors to focus on how much they are paying for each dollar of sales, removing short-term earnings noise and cyclical swings from the equation.
Ordinarily, growth prospects and business risks play a big part in what counts as a “normal” or “fair” P/S multiple. Strong future growth and low risk usually justify a higher P/S, while weaker growth or elevated risk point to a lower ratio being warranted. For this reason, simply looking at the current multiple in isolation, or even just benchmarking it to the industry average, does not always tell the full story.
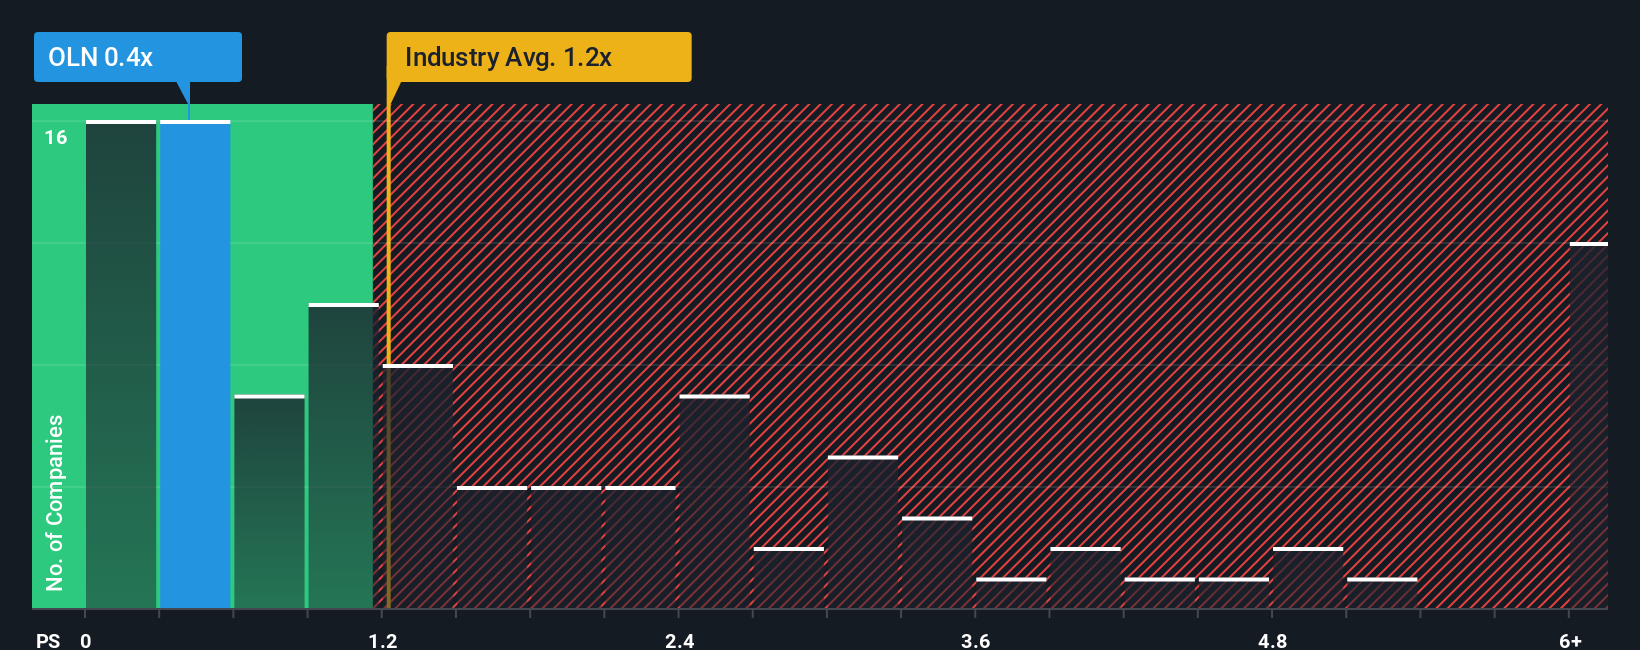
Olin currently trades at a P/S multiple of 0.45x. In context, the industry average P/S is 1.19x, and the average of Olin’s closest peers is 1.60x. However, Simply Wall St’s proprietary Fair Ratio for Olin is 0.74x. This Fair Ratio reflects nuances such as Olin’s projected growth, profit profile, industry dynamics and market cap. As a result, it provides a more tailored and accurate benchmark than straight industry or peer averages.
Comparing Olin’s actual P/S multiple of 0.45x to its Fair Ratio of 0.74x suggests the market is undervaluing the stock relative to its fundamentals and outlook at this time.
Result: UNDERVALUED
PS ratios tell one story, but what if the real opportunity lies elsewhere? Discover companies where insiders are betting big on explosive growth.
Upgrade Your Decision Making: Choose your Olin Narrative
Earlier we mentioned that there is an even better way to understand valuation, so let’s introduce you to Narratives. In simple terms, a Narrative is your personal investment story for a company like Olin, the “why” behind the numbers. Narratives tie together everything you think about Olin’s future, letting you link its unique business changes, such as cost cuts and market shifts, to your own projected revenue, earnings and margins, and finally a fair value for the stock.
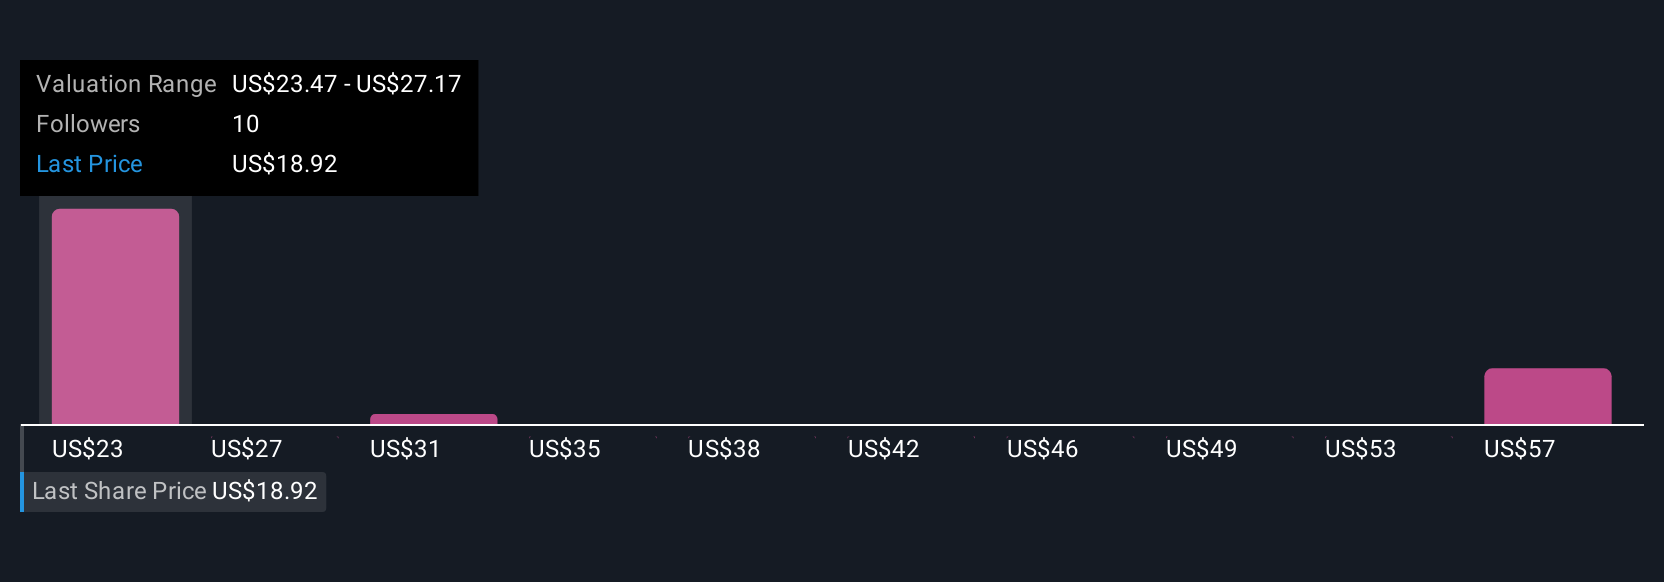
Unlike traditional models that rely on static data, Narratives on Simply Wall St’s Community page (used by millions of investors) are easy to use and update automatically as new news or financial results come in, keeping your investment thesis current. By building or following a Narrative, you connect your view of Olin’s growth to real forecasts, with a clear Fair Value you can compare directly to today’s share price, helping you decide when to buy or sell. Narratives also allow you to see where others in the community may be more optimistic or cautious. For example, one investor’s bullish Narrative assumes Olin’s fair value is as high as $31.00, while the most bearish sees it closer to $20.00.
Do you think there's more to the story for Olin? Create your own Narrative to let the Community know!
This article by Simply Wall St is general in nature. We provide commentary based on historical data and analyst forecasts only using an unbiased methodology and our articles are not intended to be financial advice. It does not constitute a recommendation to buy or sell any stock, and does not take account of your objectives, or your financial situation. We aim to bring you long-term focused analysis driven by fundamental data. Note that our analysis may not factor in the latest price-sensitive company announcements or qualitative material. Simply Wall St has no position in any stocks mentioned.
New: AI Stock Screener & Alerts
Our new AI Stock Screener scans the market every day to uncover opportunities.
• Dividend Powerhouses (3%+ Yield)
• Undervalued Small Caps with Insider Buying
• High growth Tech and AI Companies
Or build your own from over 50 metrics.
Have feedback on this article? Concerned about the content? Get in touch with us directly. Alternatively, email editorial-team@simplywallst.com
About NYSE:OLN
Olin
Manufactures and distributes chemical products in the United States, Europe, Asia Pacific, Latin America, and Canada.
Undervalued with moderate growth potential.
Similar Companies
Market Insights

Advertisement
Community Narratives
The Next Phase of Energy Storage: How NeoVolta Is Tackling America’s Power Crunch
Fair Value US$7.50|30.4% undervalued
MA
Community Contributor
A formidable player in AI and enterprise computing.
Fair Value US$210.00|3.0% undervalued
CO
Community Contributor
IREN's Bold Moves in Sustainable Bitcoin Mining & AI Data Centers
Fair Value US$72.52|20.4% undervalued
BL
Community Contributor
Cooling the Champions: The Aussie Tech Behind F1's Victories
Fair Value AU$12.40|38.1% undervalued
TR
Community Contributor