Advertisement
- United States
- /
- Metals and Mining
- /
- NYSE:NEM
What Newmont’s Soaring Stock Means After $15B Newcrest Deal and Planned Job Cuts

Simply Wall St
Reviewed by Bailey Pemberton
If you are on the fence about Newmont stock, you are definitely not alone. With its price up 4.1% over the last week and an eye-catching 14.2% rise in just the past month, Newmont has easily grabbed investors’ attention. Year-to-date, the stock has soared a staggering 136.0%, rewarding anyone who held on through the market ups and downs. Even on a longer horizon, Newmont’s returns of 65.9% in the last year and 137.6% over three years stand out in the sector.
What is driving these moves? Part of the story is optimism about rising gold and silver prices, especially after Barron's recently called Newmont "undervalued" based on its 13-times price-to-earnings ratio. At the same time, the company is making headlines by considering deep cost cuts following its $15B acquisition of Newcrest Mining. Investors see both risk and opportunity in these changes, particularly as the White House’s recent policy shift promises to keep gold imports tariff-free and markets less jittery.
But let’s get real about value. Numbers matter. According to our analyses, Newmont earns a valuation score of 3 out of 6 possible checks for being undervalued. That means the company looks attractive by several key measures, though it is not a slam dunk across the board. Over the next sections, we’ll break down exactly what goes into that score and how each valuation approach stacks up. Stick around, because we will also reveal a smarter, more comprehensive way to think about Newmont’s worth at the end.
Approach 1: Newmont Discounted Cash Flow (DCF) Analysis
The Discounted Cash Flow (DCF) model is a staple of equity valuation, as it estimates a company’s worth by projecting its future cash flows and then discounting them back to today’s value. For Newmont, this process begins by examining the company’s most recent Free Cash Flow (FCF), which stands at $4.7 billion. Analysts have provided detailed FCF forecasts for the next several years, with FCF expected to grow and reach $4.8 billion by 2029. Beyond 2029, projections are extrapolated to provide a longer-term outlook, reflecting an industry-wide expectation of gradual growth and stabilization.
All cash flows are considered in US dollars, and fluctuations are anchored by analyst input and robust financial modeling. The DCF analysis determines an intrinsic fair value of $79.16 per share for Newmont. However, the calculation also reveals that the market price currently sits about 14.4% above this fair value, which implies that the stock is overvalued based on DCF.
In summary, while Newmont generates strong cash flows and its long-term prospects are buoyed by solid projections, the current share price appears to have outpaced its intrinsic value.
Result: OVERVALUED

Our Discounted Cash Flow (DCF) analysis suggests Newmont may be overvalued by 14.4%. Find undervalued stocks or create your own screener to find better value opportunities.
Approach 2: Newmont Price vs Earnings
The Price-to-Earnings (PE) ratio is one of the go-to metrics for valuing profitable companies like Newmont, because it directly relates a company’s market price to its actual earnings power. For businesses generating steady profits, the PE ratio neatly summarizes how much investors are willing to pay per dollar of earnings and helps compare value across the sector.
It’s important to remember that what qualifies as a "fair" PE ratio can shift depending on market expectations for growth, perceived business risks, and economic context. Companies with higher growth prospects, lower risk profiles, or steadier earnings typically command higher PE multiples. In contrast, businesses facing headwinds tend to trade at a discount.
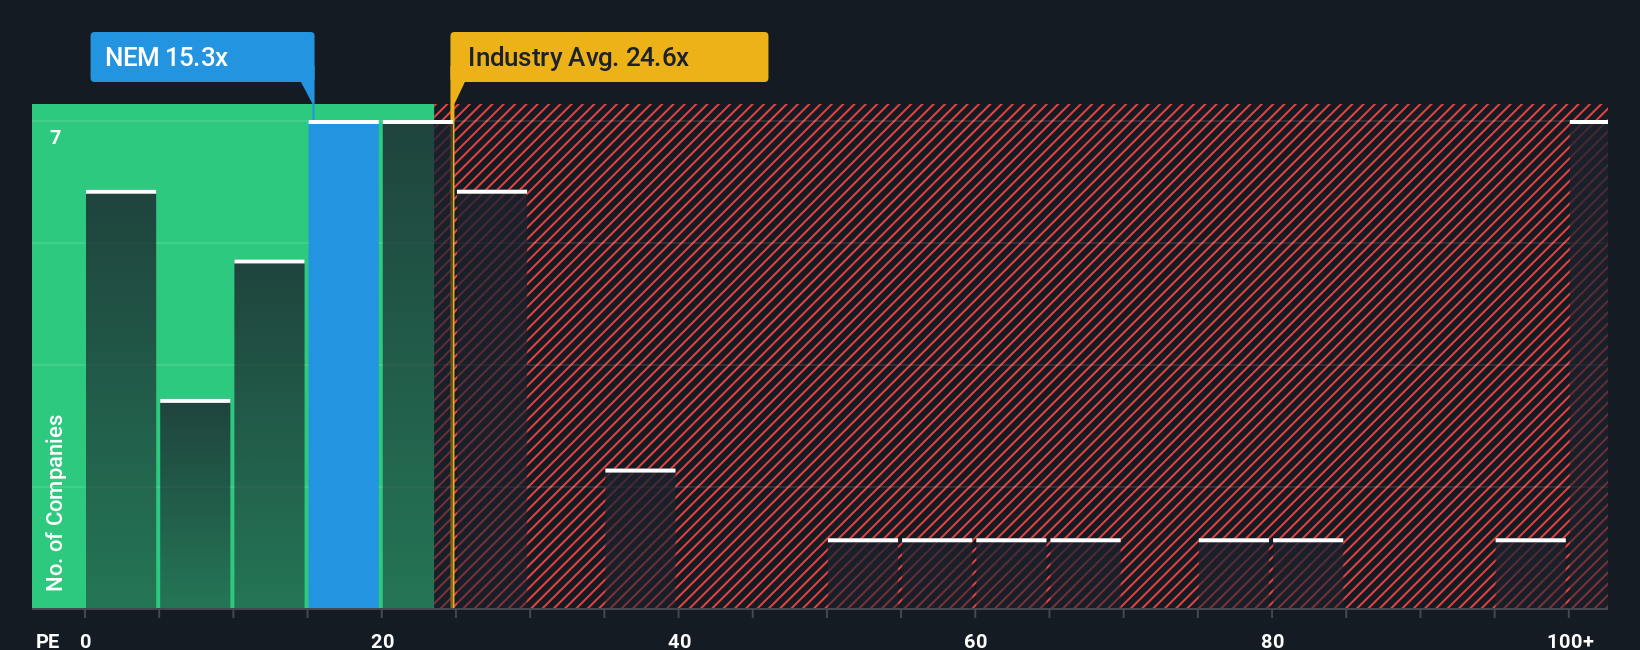
Currently, Newmont trades at a PE ratio of 15.9x, which is well below the Metals and Mining industry average of 25.7x and also below the peer group average of 37.4x. However, Simply Wall St’s “Fair Ratio” for Newmont is 24.6x. This Fair Ratio is a more tailored benchmark that reflects not just what peers or the sector are trading at, but also takes into account Newmont’s specific earnings growth, risk factors, profit margins, industry positioning, and market cap. By weighing these elements, the Fair Ratio offers a more holistic, apples-to-apples valuation than a plain comparison to industry or peer averages.
Comparing Newmont’s actual PE of 15.9x to its Fair Ratio of 24.6x, the stock appears notably undervalued by this method. This suggests the market may be underestimating its strengths and prospects.
Result: UNDERVALUED
PE ratios tell one story, but what if the real opportunity lies elsewhere? Discover companies where insiders are betting big on explosive growth.
Upgrade Your Decision Making: Choose your Newmont Narrative
Earlier we mentioned that there's an even better way to understand valuation. Let's introduce you to Narratives. A Narrative is a story that ties together your perspective on Newmont’s business by combining your views on its future revenue, earnings, margins, and risks into a living financial forecast and a fair value estimate.
With Narratives, you can see how a company’s unique story translates directly into numbers and then into a personalized fair value, making the investment decision process much clearer. Narratives are accessible and easy to use on Simply Wall St’s Community page, where millions of investors build, share, and debate their outlooks.
By comparing your Narrative’s fair value to the current share price, you can decide with more confidence whether to buy, hold, or sell. Narratives update automatically whenever relevant news or new earnings are released. For example, some Newmont investors forecast robust gold demand and successful integration of assets, resulting in a bullish fair value as high as $104.0, while others emphasize operational risks and project a more cautious outlook with a fair value as low as $58.0.
Do you think there's more to the story for Newmont? Create your own Narrative to let the Community know!
This article by Simply Wall St is general in nature. We provide commentary based on historical data and analyst forecasts only using an unbiased methodology and our articles are not intended to be financial advice. It does not constitute a recommendation to buy or sell any stock, and does not take account of your objectives, or your financial situation. We aim to bring you long-term focused analysis driven by fundamental data. Note that our analysis may not factor in the latest price-sensitive company announcements or qualitative material. Simply Wall St has no position in any stocks mentioned.
Valuation is complex, but we're here to simplify it.
Discover if Newmont might be undervalued or overvalued with our detailed analysis, featuring fair value estimates, potential risks, dividends, insider trades, and its financial condition.
Access Free AnalysisHave feedback on this article? Concerned about the content? Get in touch with us directly. Alternatively, email editorial-team@simplywallst.com
About NYSE:NEM
Excellent balance sheet and fair value.
Similar Companies
Market Insights

Advertisement
Community Narratives
A formidable player in AI and enterprise computing.
Fair Value US$210.00|3.9% overvalued
CO
Community Contributor
IREN's Bold Moves in Sustainable Bitcoin Mining & AI Data Centers
Fair Value US$89.00|21.8% undervalued
BL
Community Contributor
Cooling the Champions: The Aussie Tech Behind F1's Victories
Fair Value AU$12.40|39.4% undervalued
TR
Community Contributor