
Advertisement
- United States
- /
- Metals and Mining
- /
- NYSE:CMP
Why Compass Minerals International, Inc.'s (NYSE:CMP) High P/E Ratio Isn't Necessarily A Bad Thing

This article is written for those who want to get better at using price to earnings ratios (P/E ratios). We'll look at Compass Minerals International, Inc.'s (NYSE:CMP) P/E ratio and reflect on what it tells us about the company's share price. Based on the last twelve months, Compass Minerals International's P/E ratio is 26.94. That is equivalent to an earnings yield of about 3.7%.
See our latest analysis for Compass Minerals International
How Do I Calculate A Price To Earnings Ratio?
The formula for P/E is:
Price to Earnings Ratio = Share Price ÷ Earnings per Share (EPS)
Or for Compass Minerals International:
P/E of 26.94 = $54.37 ÷ $2.02 (Based on the trailing twelve months to December 2018.)
Is A High P/E Ratio Good?
A higher P/E ratio implies that investors pay a higher price for the earning power of the business. That is not a good or a bad thing per se, but a high P/E does imply buyers are optimistic about the future.
How Growth Rates Impact P/E Ratios
If earnings fall then in the future the 'E' will be lower. That means unless the share price falls, the P/E will increase in a few years. So while a stock may look cheap based on past earnings, it could be expensive based on future earnings.
It's nice to see that Compass Minerals International grew EPS by a stonking 62% in the last year. But earnings per share are down 22% per year over the last five years.
How Does Compass Minerals International's P/E Ratio Compare To Its Peers?
The P/E ratio essentially measures market expectations of a company. As you can see below, Compass Minerals International has a much higher P/E than the average company (8.9) in the metals and mining industry.
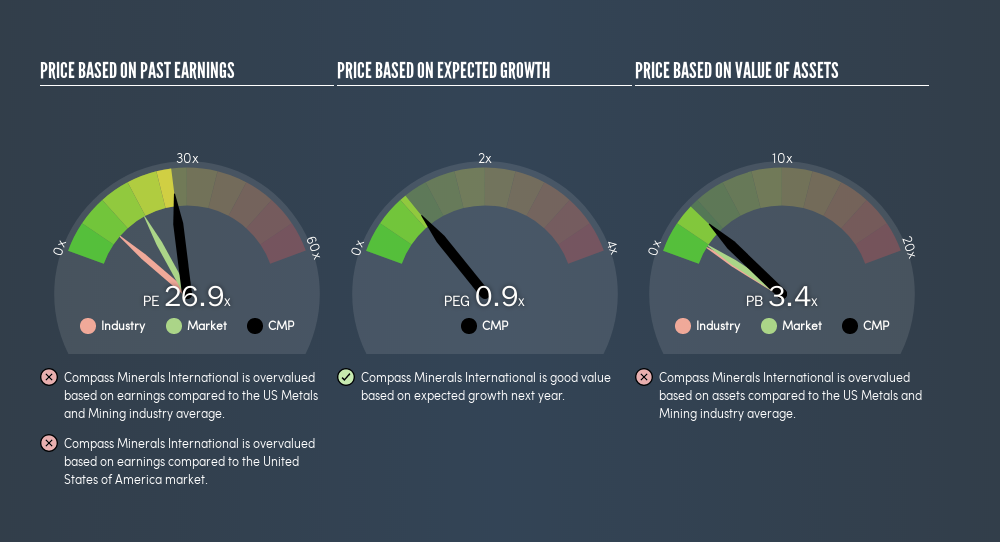
Its relatively high P/E ratio indicates that Compass Minerals International shareholders think it will perform better than other companies in its industry classification. Clearly the market expects growth, but it isn't guaranteed. So investors should delve deeper. I like to check if company insiders have been buying or selling.
A Limitation: P/E Ratios Ignore Debt and Cash In The Bank
It's important to note that the P/E ratio considers the market capitalization, not the enterprise value. Thus, the metric does not reflect cash or debt held by the company. Hypothetically, a company could reduce its future P/E ratio by spending its cash (or taking on debt) to achieve higher earnings.
Such expenditure might be good or bad, in the long term, but the point here is that the balance sheet is not reflected by this ratio.
Is Debt Impacting Compass Minerals International's P/E?
Compass Minerals International's net debt is 73% of its market cap. This is a reasonably significant level of debt -- all else being equal you'd expect a much lower P/E than if it had net cash.
The Bottom Line On Compass Minerals International's P/E Ratio
Compass Minerals International has a P/E of 26.9. That's higher than the average in the US market, which is 17.7. It has already proven it can grow earnings, but the debt levels mean it faces some risks. The relatively high P/E ratio suggests shareholders think growth will continue.
Investors should be looking to buy stocks that the market is wrong about. As value investor Benjamin Graham famously said, 'In the short run, the market is a voting machine but in the long run, it is a weighing machine.' So this freevisualization of the analyst consensus on future earnings could help you make the right decision about whether to buy, sell, or hold.
Of course, you might find a fantastic investment by looking at a few good candidates. So take a peek at this freelist of companies with modest (or no) debt, trading on a P/E below 20.
We aim to bring you long-term focused research analysis driven by fundamental data. Note that our analysis may not factor in the latest price-sensitive company announcements or qualitative material.
If you spot an error that warrants correction, please contact the editor at editorial-team@simplywallst.com. This article by Simply Wall St is general in nature. It does not constitute a recommendation to buy or sell any stock, and does not take account of your objectives, or your financial situation. Simply Wall St has no position in the stocks mentioned. Thank you for reading.
About NYSE:CMP
Compass Minerals International
Provides essential minerals in the United States, Canada, the United Kingdom, and internationally.
Moderate growth potential with mediocre balance sheet.
Similar Companies
Market Insights


Advertisement
Community Narratives
Suncorp’s Next Chapter: Insurance-Only and Ready to Grow
Fair Value AU$22.83|4.9% undervalued
RO
Community Contributor
Thyssenkrupp Nucera Will Achieve Double-Digit Profits by 2030 Boosted by Hydrogen Growth
Fair Value €14.40|32.5% undervalued
CH
Community Contributor
Tesla’s Nvidia Moment – The AI & Robotics Inflection Point
Fair Value US$384.84|21.9% undervalued
BL
Community Contributor