

Legendary fund manager Li Lu (who Charlie Munger backed) once said, 'The biggest investment risk is not the volatility of prices, but whether you will suffer a permanent loss of capital.' So it seems the smart money knows that debt - which is usually involved in bankruptcies - is a very important factor, when you assess how risky a company is. As with many other companies Commercial Metals Company (NYSE:CMC) makes use of debt. But is this debt a concern to shareholders?
When Is Debt A Problem?
Debt and other liabilities become risky for a business when it cannot easily fulfill those obligations, either with free cash flow or by raising capital at an attractive price. Ultimately, if the company can't fulfill its legal obligations to repay debt, shareholders could walk away with nothing. However, a more frequent (but still costly) occurrence is where a company must issue shares at bargain-basement prices, permanently diluting shareholders, just to shore up its balance sheet. By replacing dilution, though, debt can be an extremely good tool for businesses that need capital to invest in growth at high rates of return. The first thing to do when considering how much debt a business uses is to look at its cash and debt together.
Check out our latest analysis for Commercial Metals
How Much Debt Does Commercial Metals Carry?
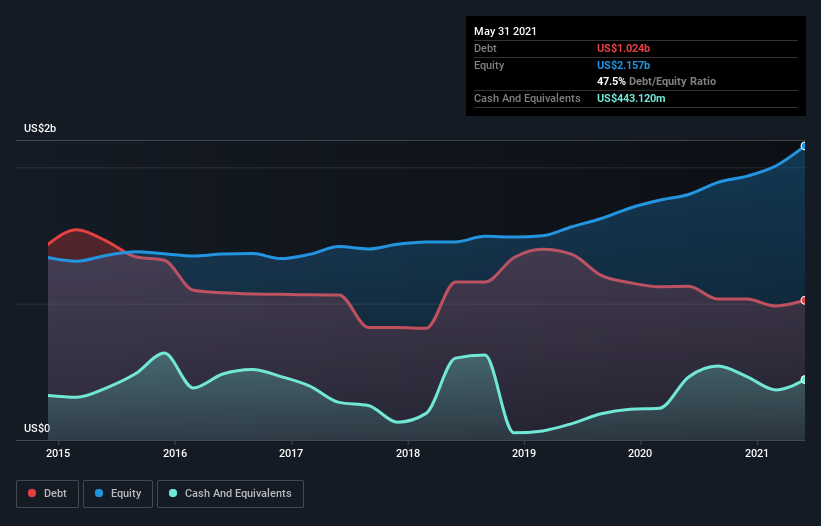
The image below, which you can click on for greater detail, shows that Commercial Metals had debt of US$1.02b at the end of May 2021, a reduction from US$1.13b over a year. However, because it has a cash reserve of US$443.1m, its net debt is less, at about US$581.4m.
A Look At Commercial Metals' Liabilities
Zooming in on the latest balance sheet data, we can see that Commercial Metals had liabilities of US$853.4m due within 12 months and liabilities of US$1.38b due beyond that. Offsetting this, it had US$443.1m in cash and US$1.07b in receivables that were due within 12 months. So its liabilities outweigh the sum of its cash and (near-term) receivables by US$718.2m.
Since publicly traded Commercial Metals shares are worth a total of US$3.66b, it seems unlikely that this level of liabilities would be a major threat. Having said that, it's clear that we should continue to monitor its balance sheet, lest it change for the worse.
We use two main ratios to inform us about debt levels relative to earnings. The first is net debt divided by earnings before interest, tax, depreciation, and amortization (EBITDA), while the second is how many times its earnings before interest and tax (EBIT) covers its interest expense (or its interest cover, for short). The advantage of this approach is that we take into account both the absolute quantum of debt (with net debt to EBITDA) and the actual interest expenses associated with that debt (with its interest cover ratio).
With net debt sitting at just 0.89 times EBITDA, Commercial Metals is arguably pretty conservatively geared. And this view is supported by the solid interest coverage, with EBIT coming in at 9.3 times the interest expense over the last year. Commercial Metals's EBIT was pretty flat over the last year, but that shouldn't be an issue given the it doesn't have a lot of debt. When analysing debt levels, the balance sheet is the obvious place to start. But ultimately the future profitability of the business will decide if Commercial Metals can strengthen its balance sheet over time. So if you're focused on the future you can check out this free report showing analyst profit forecasts.
Finally, a company can only pay off debt with cold hard cash, not accounting profits. So it's worth checking how much of that EBIT is backed by free cash flow. In the last three years, Commercial Metals's free cash flow amounted to 26% of its EBIT, less than we'd expect. That weak cash conversion makes it more difficult to handle indebtedness.
Our View
Commercial Metals's interest cover was a real positive on this analysis, as was its net debt to EBITDA. Having said that, its conversion of EBIT to free cash flow somewhat sensitizes us to potential future risks to the balance sheet. Looking at all this data makes us feel a little cautious about Commercial Metals's debt levels. While debt does have its upside in higher potential returns, we think shareholders should definitely consider how debt levels might make the stock more risky. There's no doubt that we learn most about debt from the balance sheet. However, not all investment risk resides within the balance sheet - far from it. We've identified 2 warning signs with Commercial Metals (at least 1 which shouldn't be ignored) , and understanding them should be part of your investment process.
At the end of the day, it's often better to focus on companies that are free from net debt. You can access our special list of such companies (all with a track record of profit growth). It's free.
If you decide to trade Commercial Metals, use the lowest-cost* platform that is rated #1 Overall by Barron’s, Interactive Brokers. Trade stocks, options, futures, forex, bonds and funds on 135 markets, all from a single integrated account. Promoted
If you're looking to trade Commercial Metals, open an account with the lowest-cost platform trusted by professionals, Interactive Brokers.
With clients in over 200 countries and territories, and access to 160 markets, IBKR lets you trade stocks, options, futures, forex, bonds and funds from a single integrated account.
Enjoy no hidden fees, no account minimums, and FX conversion rates as low as 0.03%, far better than what most brokers offer.
Sponsored ContentNew: AI Stock Screener & Alerts
Our new AI Stock Screener scans the market every day to uncover opportunities.
• Dividend Powerhouses (3%+ Yield)
• Undervalued Small Caps with Insider Buying
• High growth Tech and AI Companies
Or build your own from over 50 metrics.
This article by Simply Wall St is general in nature. We provide commentary based on historical data and analyst forecasts only using an unbiased methodology and our articles are not intended to be financial advice. It does not constitute a recommendation to buy or sell any stock, and does not take account of your objectives, or your financial situation. We aim to bring you long-term focused analysis driven by fundamental data. Note that our analysis may not factor in the latest price-sensitive company announcements or qualitative material. Simply Wall St has no position in any stocks mentioned.
*Interactive Brokers Rated Lowest Cost Broker by StockBrokers.com Annual Online Review 2020
Have feedback on this article? Concerned about the content? Get in touch with us directly. Alternatively, email editorial-team (at) simplywallst.com.
About NYSE:CMC
Commercial Metals
Manufactures, recycles, and fabricates steel and metal products, and related materials and services in the United States, Poland, China, and internationally.
Flawless balance sheet with moderate growth potential.
Similar Companies
Market Insights

Community Narratives

