Advertisement
- United States
- /
- Metals and Mining
- /
- NYSE:B
Does Barrick Gold’s Recent 15% Rally Signal More Room for Growth in 2025?

Simply Wall St
Reviewed by Bailey Pemberton
If you have been watching Barrick Mining stock lately and wondering what your next move should be, you are definitely not alone. This gold mining giant has caught the eye of many investors for good reason. Over the last month alone, Barrick’s share price jumped 15.1%, capping off a stellar year-to-date return of 109.3%. Even the one-year gain of 71.0% stacks up impressively against the sector and broader market. But there is more to the story than short-term pops. Over the past three years, Barrick has delivered a remarkable 146.3% return, showing a powerful trend that is hard to ignore, even after accounting for the more modest five-year gain of 42.6%. That said, markets never move without reason.
Recent global shifts in monetary policy and renewed interest in gold as a hedge have put miners like Barrick back in the limelight. The market seems to be pricing in growth potential. This could be signaling decreased risk perception, but as with any hot stock, the real question is whether these moves are justified by the company’s underlying value or if investors are simply chasing gold’s glitter.
To get a clearer picture, we ran Barrick through six rigorous valuation checks. The result? Barrick scored a 4 out of 6, indicating it appears undervalued on most major metrics. That is a promising sign, but before we jump to conclusions, let’s break down exactly how we arrive at that score. Plus, stick around as we reveal one approach that can give you an even deeper perspective on what Barrick Mining might truly be worth.
Approach 1: Barrick Mining Discounted Cash Flow (DCF) Analysis
The Discounted Cash Flow (DCF) model is a widely used valuation approach that projects a company’s future cash flows and discounts them back to today’s value to estimate what the business is really worth. It helps investors determine whether Barrick Mining’s current share price aligns with its long-term earning potential.
Barrick Mining’s latest reported Free Cash Flow (FCF) stands at approximately $1.43 billion. Analyst forecasts show solid growth in the coming years, with FCF expected to reach $3.36 billion by 2029. The 10-year outlook, which goes beyond analyst projections and includes extrapolations by Simply Wall St, suggests annual FCFs consistently above $3 billion over the next decade. These robust expectations indicate that Barrick continues to generate substantial cash, a critical factor for valuing mining companies.
Based on the 2 Stage Free Cash Flow to Equity model, this DCF analysis estimates Barrick’s fair value at $37.35 per share. Compared to the current market price, this assessment implies the stock is around 10.5% undervalued.
Result: UNDERVALUED
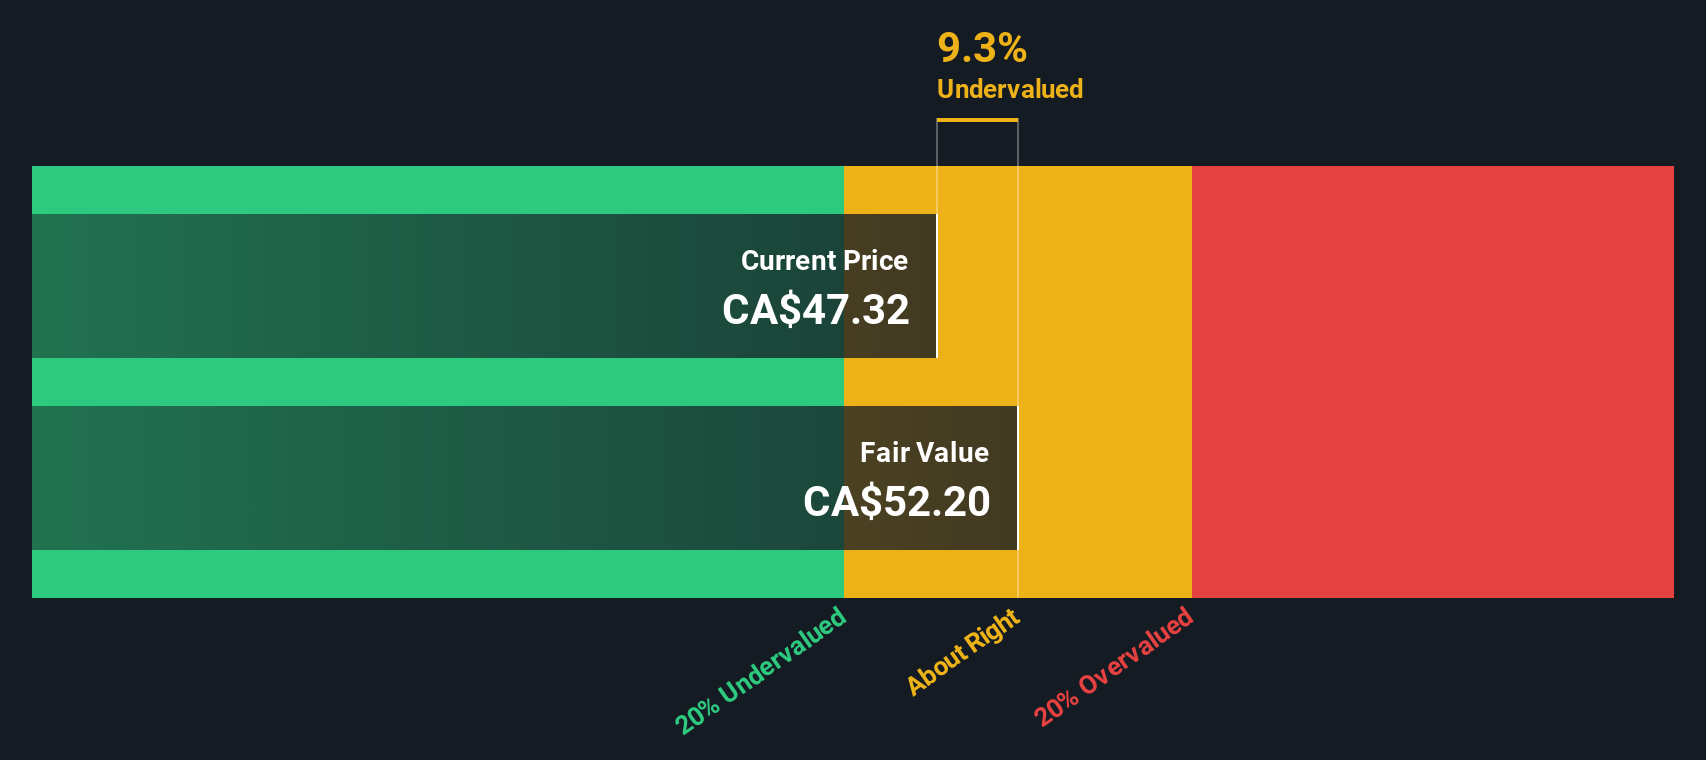
Our Discounted Cash Flow (DCF) analysis suggests Barrick Mining is undervalued by 10.5%. Track this in your watchlist or portfolio, or discover more undervalued stocks.
Approach 2: Barrick Mining Price vs Earnings
The Price-to-Earnings (PE) ratio is a classic and effective valuation tool, especially for profitable companies like Barrick Mining. By comparing a company’s share price relative to its earnings, investors can quickly gauge how much the market is willing to pay for each dollar of profit. It allows for simple comparisons, but is most meaningful for firms with steady and predictable earnings streams.
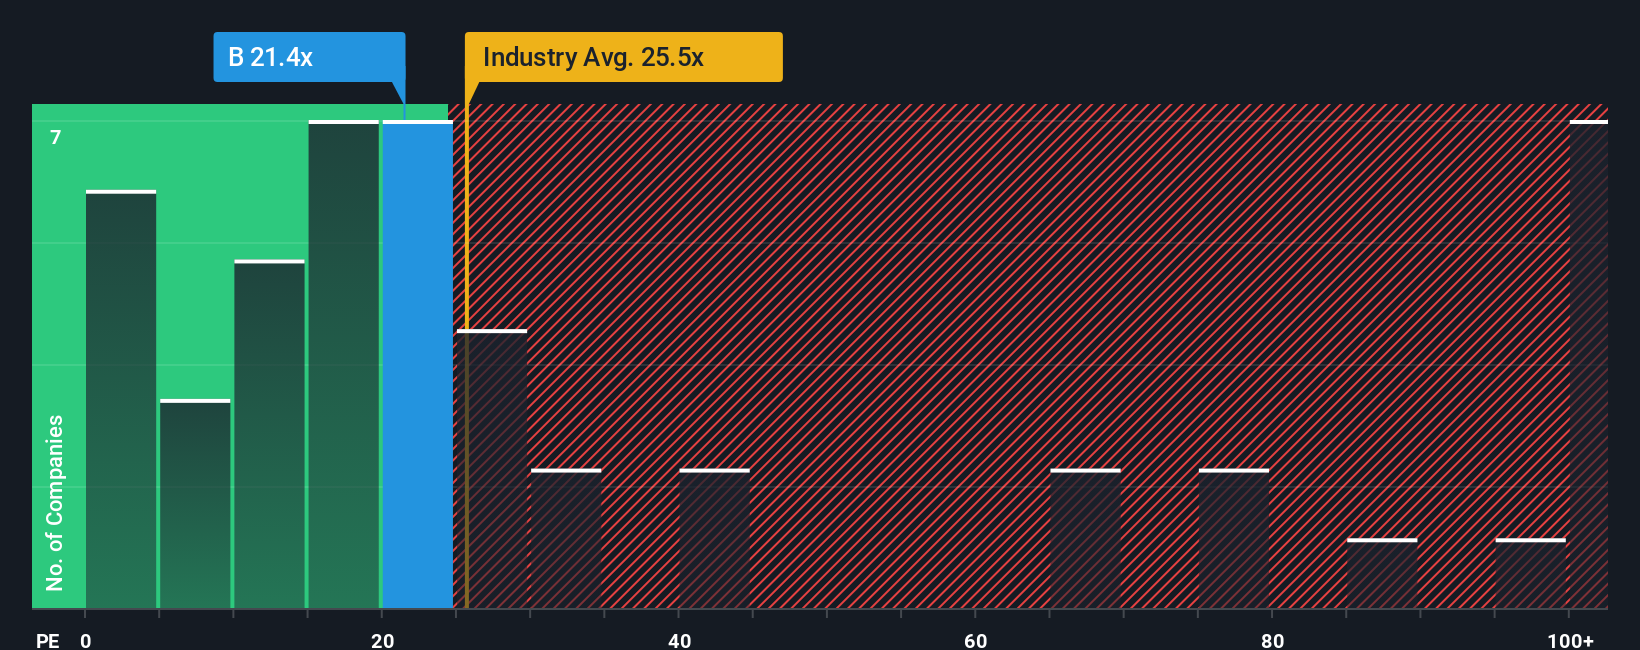
Growth expectations and risk levels are key factors influencing what constitutes a “fair” PE multiple. Companies with higher expected growth or stable earnings typically justify higher PE ratios, while riskier businesses or those with more volatile profits tend to trade at lower multiples. For Barrick Mining, the current PE ratio stands at 20.2x, which is below both the industry average of 24.6x and the peer group average of 23.7x. On the surface, this might suggest Barrick is undervalued compared to its sector and competitors.
However, it is crucial to dig deeper than just headline benchmarks. Simply Wall St’s proprietary “Fair Ratio” makes a more holistic assessment, factoring in not only the company’s growth outlook and risks, but also its profit margins, industry dynamics, and market cap. For Barrick, the calculated Fair Ratio is 27.2x, offering a more tailored view of what investors should reasonably expect to pay. In contrast to simple averages, the Fair Ratio serves as a better guide because it adjusts for Barrick’s unique position within the industry and its specific financial profile. Since Barrick’s current PE ratio is well below this Fair Ratio, it strengthens the case for the stock being undervalued at its current price.
Result: UNDERVALUED
PE ratios tell one story, but what if the real opportunity lies elsewhere? Discover companies where insiders are betting big on explosive growth.
Upgrade Your Decision Making: Choose your Barrick Mining Narrative
Earlier we mentioned that there is an even better way to understand valuation, so let’s introduce you to Narratives. A Narrative is simply your story, your own perspective about Barrick Mining that connects the company’s current realities, your forecast of its future revenue, earnings, and margins, and your idea of what the stock should be worth. It transforms complex financials into a clear, reasoned view that links business events to a fair value estimate.
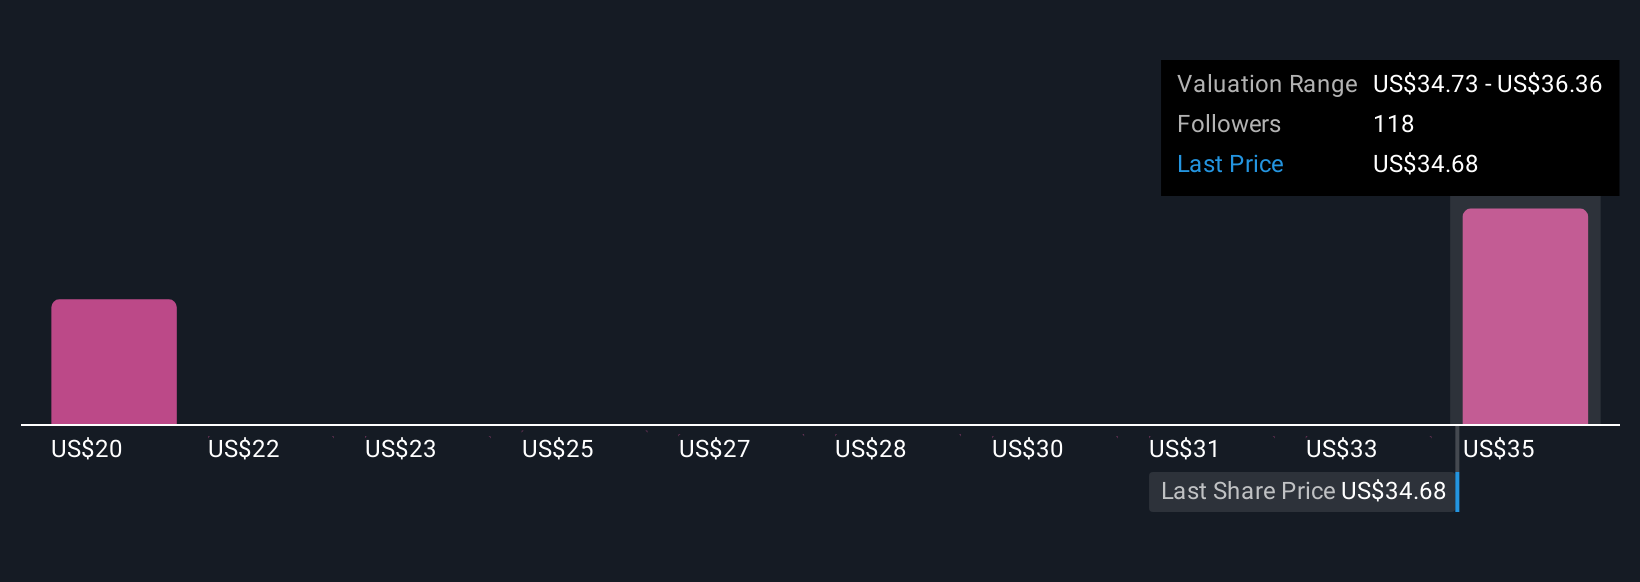
This approach is accessible and practical, available directly on the Community page of Simply Wall St, where millions of investors put Narratives to work every day. Narratives are especially powerful because they help you answer the essential question: when should you buy or sell? By automatically comparing your fair value to the latest market price, Narratives provide clear guidance. Plus, as new quarterly results or news surface, your Narrative updates instantly. This keeps your decision-making always relevant to the latest facts. For instance, one investor might expect long-term revenue growth and assign Barrick Mining a fair value of $20.44 per share, while another believes in a stronger super-cycle and forecasts fair value at $36 per share. This illustrates how different outlooks turn into actionable investment strategies.
Do you think there's more to the story for Barrick Mining? Create your own Narrative to let the Community know!
This article by Simply Wall St is general in nature. We provide commentary based on historical data and analyst forecasts only using an unbiased methodology and our articles are not intended to be financial advice. It does not constitute a recommendation to buy or sell any stock, and does not take account of your objectives, or your financial situation. We aim to bring you long-term focused analysis driven by fundamental data. Note that our analysis may not factor in the latest price-sensitive company announcements or qualitative material. Simply Wall St has no position in any stocks mentioned.
Valuation is complex, but we're here to simplify it.
Discover if Barrick Mining might be undervalued or overvalued with our detailed analysis, featuring fair value estimates, potential risks, dividends, insider trades, and its financial condition.
Access Free AnalysisHave feedback on this article? Concerned about the content? Get in touch with us directly. Alternatively, email editorial-team@simplywallst.com
About NYSE:B
Barrick Mining
Engages in the exploration, development, production, and sale of mineral properties.
Excellent balance sheet and good value.
Similar Companies
Market Insights

Advertisement
Community Narratives
A formidable player in AI and enterprise computing.
Fair Value US$210.00|3.1% overvalued
CO
Community Contributor
IREN's Bold Moves in Sustainable Bitcoin Mining & AI Data Centers
Fair Value US$72.52|11.6% undervalued
BL
Community Contributor
Cooling the Champions: The Aussie Tech Behind F1's Victories
Fair Value AU$12.40|40.4% undervalued
TR
Community Contributor