- United States
- /
- Metals and Mining
- /
- NasdaqGS:RGLD
These 4 Measures Indicate That Royal Gold (NASDAQ:RGLD) Is Using Debt Reasonably Well


Some say volatility, rather than debt, is the best way to think about risk as an investor, but Warren Buffett famously said that 'Volatility is far from synonymous with risk.' When we think about how risky a company is, we always like to look at its use of debt, since debt overload can lead to ruin. We note that Royal Gold, Inc. (NASDAQ:RGLD) does have debt on its balance sheet. But is this debt a concern to shareholders?
When Is Debt Dangerous?
Debt and other liabilities become risky for a business when it cannot easily fulfill those obligations, either with free cash flow or by raising capital at an attractive price. In the worst case scenario, a company can go bankrupt if it cannot pay its creditors. However, a more frequent (but still costly) occurrence is where a company must issue shares at bargain-basement prices, permanently diluting shareholders, just to shore up its balance sheet. By replacing dilution, though, debt can be an extremely good tool for businesses that need capital to invest in growth at high rates of return. When we think about a company's use of debt, we first look at cash and debt together.
View our latest analysis for Royal Gold
How Much Debt Does Royal Gold Carry?
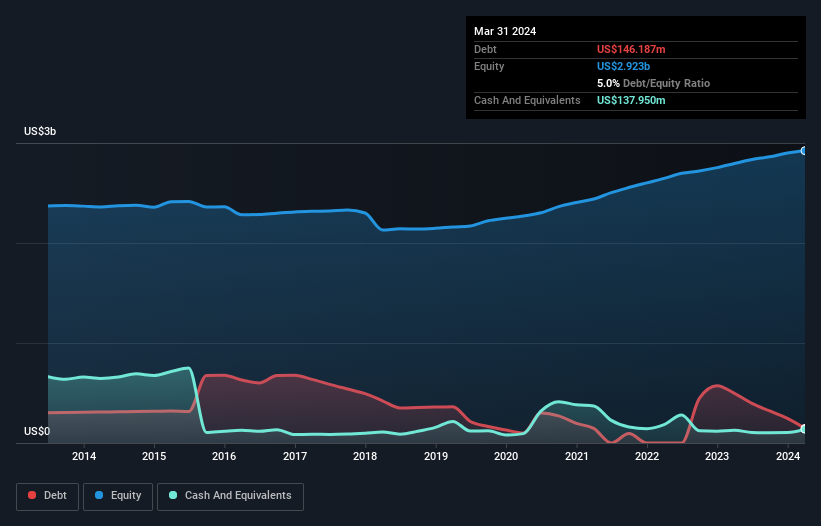
As you can see below, Royal Gold had US$146.2m of debt at March 2024, down from US$496.8m a year prior. On the flip side, it has US$138.0m in cash leading to net debt of about US$8.24m.
How Healthy Is Royal Gold's Balance Sheet?
Zooming in on the latest balance sheet data, we can see that Royal Gold had liabilities of US$77.1m due within 12 months and liabilities of US$312.8m due beyond that. Offsetting this, it had US$138.0m in cash and US$41.9m in receivables that were due within 12 months. So its liabilities total US$210.1m more than the combination of its cash and short-term receivables.
Since publicly traded Royal Gold shares are worth a total of US$8.13b, it seems unlikely that this level of liabilities would be a major threat. Having said that, it's clear that we should continue to monitor its balance sheet, lest it change for the worse. But either way, Royal Gold has virtually no net debt, so it's fair to say it does not have a heavy debt load!
In order to size up a company's debt relative to its earnings, we calculate its net debt divided by its earnings before interest, tax, depreciation, and amortization (EBITDA) and its earnings before interest and tax (EBIT) divided by its interest expense (its interest cover). Thus we consider debt relative to earnings both with and without depreciation and amortization expenses.
With debt at a measly 0.018 times EBITDA and EBIT covering interest a whopping 22.3 times, it's clear that Royal Gold is not a desperate borrower. So relative to past earnings, the debt load seems trivial. Royal Gold's EBIT was pretty flat over the last year, but that shouldn't be an issue given the it doesn't have a lot of debt. When analysing debt levels, the balance sheet is the obvious place to start. But it is future earnings, more than anything, that will determine Royal Gold's ability to maintain a healthy balance sheet going forward. So if you're focused on the future you can check out this free report showing analyst profit forecasts.
Finally, a company can only pay off debt with cold hard cash, not accounting profits. So we clearly need to look at whether that EBIT is leading to corresponding free cash flow. Over the last three years, Royal Gold reported free cash flow worth 5.3% of its EBIT, which is really quite low. For us, cash conversion that low sparks a little paranoia about is ability to extinguish debt.
Our View
Happily, Royal Gold's impressive interest cover implies it has the upper hand on its debt. But we must concede we find its conversion of EBIT to free cash flow has the opposite effect. Looking at all the aforementioned factors together, it strikes us that Royal Gold can handle its debt fairly comfortably. On the plus side, this leverage can boost shareholder returns, but the potential downside is more risk of loss, so it's worth monitoring the balance sheet. Above most other metrics, we think its important to track how fast earnings per share is growing, if at all. If you've also come to that realization, you're in luck, because today you can view this interactive graph of Royal Gold's earnings per share history for free.
At the end of the day, it's often better to focus on companies that are free from net debt. You can access our special list of such companies (all with a track record of profit growth). It's free.
New: AI Stock Screener & Alerts
Our new AI Stock Screener scans the market every day to uncover opportunities.
• Dividend Powerhouses (3%+ Yield)
• Undervalued Small Caps with Insider Buying
• High growth Tech and AI Companies
Or build your own from over 50 metrics.
Have feedback on this article? Concerned about the content? Get in touch with us directly. Alternatively, email editorial-team (at) simplywallst.com.
This article by Simply Wall St is general in nature. We provide commentary based on historical data and analyst forecasts only using an unbiased methodology and our articles are not intended to be financial advice. It does not constitute a recommendation to buy or sell any stock, and does not take account of your objectives, or your financial situation. We aim to bring you long-term focused analysis driven by fundamental data. Note that our analysis may not factor in the latest price-sensitive company announcements or qualitative material. Simply Wall St has no position in any stocks mentioned.
About NasdaqGS:RGLD
Royal Gold
Acquires and manages precious metal streams, royalties, and related interests.
Flawless balance sheet with solid track record and pays a dividend.
Similar Companies
Market Insights

Community Narratives

