

Legendary fund manager Li Lu (who Charlie Munger backed) once said, 'The biggest investment risk is not the volatility of prices, but whether you will suffer a permanent loss of capital.' So it seems the smart money knows that debt - which is usually involved in bankruptcies - is a very important factor, when you assess how risky a company is. Importantly, Royal Gold, Inc. (NASDAQ:RGLD) does carry debt. But the real question is whether this debt is making the company risky.
When Is Debt A Problem?
Generally speaking, debt only becomes a real problem when a company can't easily pay it off, either by raising capital or with its own cash flow. Part and parcel of capitalism is the process of 'creative destruction' where failed businesses are mercilessly liquidated by their bankers. However, a more usual (but still expensive) situation is where a company must dilute shareholders at a cheap share price simply to get debt under control. Having said that, the most common situation is where a company manages its debt reasonably well - and to its own advantage. When we think about a company's use of debt, we first look at cash and debt together.
Check out our latest analysis for Royal Gold
What Is Royal Gold's Net Debt?
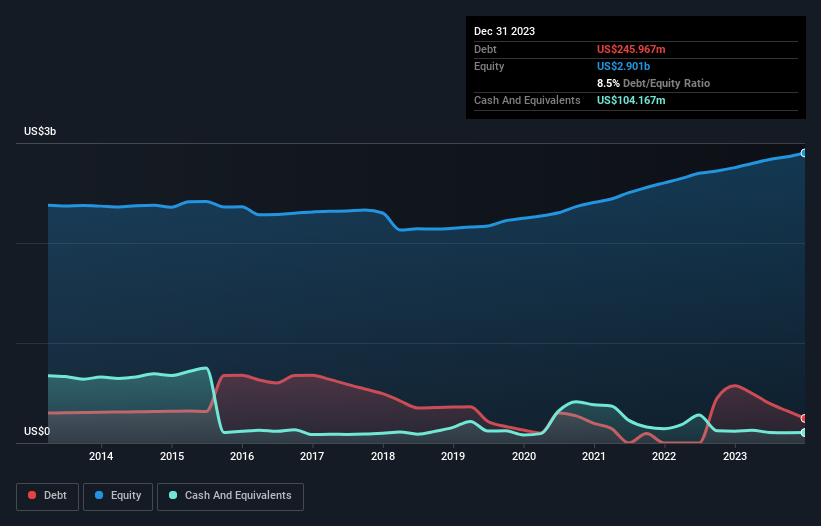
As you can see below, Royal Gold had US$246.0m of debt at December 2023, down from US$571.6m a year prior. However, it also had US$104.2m in cash, and so its net debt is US$141.8m.
How Strong Is Royal Gold's Balance Sheet?
We can see from the most recent balance sheet that Royal Gold had liabilities of US$72.4m falling due within a year, and liabilities of US$388.0m due beyond that. On the other hand, it had cash of US$104.2m and US$51.6m worth of receivables due within a year. So its liabilities outweigh the sum of its cash and (near-term) receivables by US$304.7m.
Since publicly traded Royal Gold shares are worth a total of US$7.41b, it seems unlikely that this level of liabilities would be a major threat. Having said that, it's clear that we should continue to monitor its balance sheet, lest it change for the worse.
We measure a company's debt load relative to its earnings power by looking at its net debt divided by its earnings before interest, tax, depreciation, and amortization (EBITDA) and by calculating how easily its earnings before interest and tax (EBIT) cover its interest expense (interest cover). Thus we consider debt relative to earnings both with and without depreciation and amortization expenses.
Royal Gold's net debt is only 0.30 times its EBITDA. And its EBIT covers its interest expense a whopping 16.4 times over. So you could argue it is no more threatened by its debt than an elephant is by a mouse. Fortunately, Royal Gold grew its EBIT by 6.9% in the last year, making that debt load look even more manageable. When analysing debt levels, the balance sheet is the obvious place to start. But it is future earnings, more than anything, that will determine Royal Gold's ability to maintain a healthy balance sheet going forward. So if you want to see what the professionals think, you might find this free report on analyst profit forecasts to be interesting.
Finally, a business needs free cash flow to pay off debt; accounting profits just don't cut it. So it's worth checking how much of that EBIT is backed by free cash flow. Considering the last three years, Royal Gold actually recorded a cash outflow, overall. Debt is far more risky for companies with unreliable free cash flow, so shareholders should be hoping that the past expenditure will produce free cash flow in the future.
Our View
Royal Gold's interest cover was a real positive on this analysis, as was its net debt to EBITDA. But truth be told its conversion of EBIT to free cash flow had us nibbling our nails. Considering this range of data points, we think Royal Gold is in a good position to manage its debt levels. But a word of caution: we think debt levels are high enough to justify ongoing monitoring. Above most other metrics, we think its important to track how fast earnings per share is growing, if at all. If you've also come to that realization, you're in luck, because today you can view this interactive graph of Royal Gold's earnings per share history for free.
Of course, if you're the type of investor who prefers buying stocks without the burden of debt, then don't hesitate to discover our exclusive list of net cash growth stocks, today.
New: AI Stock Screener & Alerts
Our new AI Stock Screener scans the market every day to uncover opportunities.
• Dividend Powerhouses (3%+ Yield)
• Undervalued Small Caps with Insider Buying
• High growth Tech and AI Companies
Or build your own from over 50 metrics.
Have feedback on this article? Concerned about the content? Get in touch with us directly. Alternatively, email editorial-team (at) simplywallst.com.
This article by Simply Wall St is general in nature. We provide commentary based on historical data and analyst forecasts only using an unbiased methodology and our articles are not intended to be financial advice. It does not constitute a recommendation to buy or sell any stock, and does not take account of your objectives, or your financial situation. We aim to bring you long-term focused analysis driven by fundamental data. Note that our analysis may not factor in the latest price-sensitive company announcements or qualitative material. Simply Wall St has no position in any stocks mentioned.
About NasdaqGS:RGLD
Royal Gold
Acquires and manages precious metal streams, royalties, and related interests.
Flawless balance sheet with solid track record and pays a dividend.
Similar Companies
Market Insights

Community Narratives

