
Advertisement
- United States
- /
- Chemicals
- /
- NasdaqGS:BCPC
Is Balchem Corporation (NASDAQ:BCPC) Expensive For A Reason? A Look At Its Intrinsic Value
Key Insights
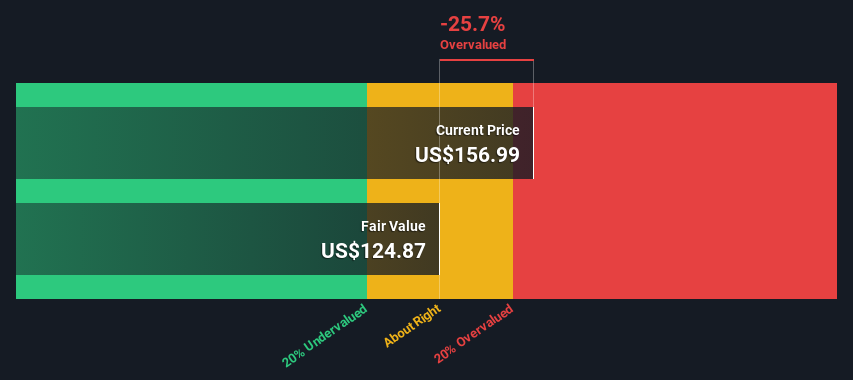
- Balchem's estimated fair value is US$125 based on 2 Stage Free Cash Flow to Equity
- Balchem's US$157 share price signals that it might be 26% overvalued
- Balchem's peers seem to be trading at a lower premium to fair value based onthe industry average of -12%
Today we will run through one way of estimating the intrinsic value of Balchem Corporation (NASDAQ:BCPC) by projecting its future cash flows and then discounting them to today's value. This will be done using the Discounted Cash Flow (DCF) model. There's really not all that much to it, even though it might appear quite complex.
Companies can be valued in a lot of ways, so we would point out that a DCF is not perfect for every situation. For those who are keen learners of equity analysis, the Simply Wall St analysis model here may be something of interest to you.
Check out our latest analysis for Balchem
What's The Estimated Valuation?
We are going to use a two-stage DCF model, which, as the name states, takes into account two stages of growth. The first stage is generally a higher growth period which levels off heading towards the terminal value, captured in the second 'steady growth' period. To start off with, we need to estimate the next ten years of cash flows. Where possible we use analyst estimates, but when these aren't available we extrapolate the previous free cash flow (FCF) from the last estimate or reported value. We assume companies with shrinking free cash flow will slow their rate of shrinkage, and that companies with growing free cash flow will see their growth rate slow, over this period. We do this to reflect that growth tends to slow more in the early years than it does in later years.
A DCF is all about the idea that a dollar in the future is less valuable than a dollar today, so we discount the value of these future cash flows to their estimated value in today's dollars:
10-year free cash flow (FCF) forecast
| 2024 | 2025 | 2026 | 2027 | 2028 | 2029 | 2030 | 2031 | 2032 | 2033 | |
| Levered FCF ($, Millions) | US$160.7m | US$172.6m | US$181.6m | US$189.6m | US$196.7m | US$203.2m | US$209.3m | US$215.2m | US$220.9m | US$226.5m |
| Growth Rate Estimate Source | Analyst x1 | Analyst x2 | Est @ 5.27% | Est @ 4.38% | Est @ 3.75% | Est @ 3.31% | Est @ 3.01% | Est @ 2.79% | Est @ 2.64% | Est @ 2.54% |
| Present Value ($, Millions) Discounted @ 6.8% | US$150 | US$151 | US$149 | US$146 | US$142 | US$137 | US$132 | US$127 | US$122 | US$117 |
("Est" = FCF growth rate estimated by Simply Wall St)
Present Value of 10-year Cash Flow (PVCF) = US$1.4b
We now need to calculate the Terminal Value, which accounts for all the future cash flows after this ten year period. The Gordon Growth formula is used to calculate Terminal Value at a future annual growth rate equal to the 5-year average of the 10-year government bond yield of 2.3%. We discount the terminal cash flows to today's value at a cost of equity of 6.8%.
Terminal Value (TV)= FCF2033 × (1 + g) ÷ (r – g) = US$226m× (1 + 2.3%) ÷ (6.8%– 2.3%) = US$5.1b
Present Value of Terminal Value (PVTV)= TV / (1 + r)10= US$5.1b÷ ( 1 + 6.8%)10= US$2.7b
The total value, or equity value, is then the sum of the present value of the future cash flows, which in this case is US$4.0b. The last step is to then divide the equity value by the number of shares outstanding. Compared to the current share price of US$157, the company appears slightly overvalued at the time of writing. Valuations are imprecise instruments though, rather like a telescope - move a few degrees and end up in a different galaxy. Do keep this in mind.
The Assumptions
The calculation above is very dependent on two assumptions. The first is the discount rate and the other is the cash flows. You don't have to agree with these inputs, I recommend redoing the calculations yourself and playing with them. The DCF also does not consider the possible cyclicality of an industry, or a company's future capital requirements, so it does not give a full picture of a company's potential performance. Given that we are looking at Balchem as potential shareholders, the cost of equity is used as the discount rate, rather than the cost of capital (or weighted average cost of capital, WACC) which accounts for debt. In this calculation we've used 6.8%, which is based on a levered beta of 0.982. Beta is a measure of a stock's volatility, compared to the market as a whole. We get our beta from the industry average beta of globally comparable companies, with an imposed limit between 0.8 and 2.0, which is a reasonable range for a stable business.
SWOT Analysis for Balchem
Strength
- Earnings growth over the past year exceeded the industry.
- Debt is not viewed as a risk.
Weakness
- Earnings growth over the past year is below its 5-year average.
- Dividend is low compared to the top 25% of dividend payers in the Chemicals market.
- Expensive based on P/E ratio and estimated fair value.
Opportunity
- Annual earnings are forecast to grow faster than the American market.
Threat
- No apparent threats visible for BCPC.
Looking Ahead:
Valuation is only one side of the coin in terms of building your investment thesis, and it ideally won't be the sole piece of analysis you scrutinize for a company. It's not possible to obtain a foolproof valuation with a DCF model. Rather it should be seen as a guide to "what assumptions need to be true for this stock to be under/overvalued?" If a company grows at a different rate, or if its cost of equity or risk free rate changes sharply, the output can look very different. What is the reason for the share price exceeding the intrinsic value? For Balchem, we've put together three further aspects you should look at:
- Risks: You should be aware of the 1 warning sign for Balchem we've uncovered before considering an investment in the company.
- Future Earnings: How does BCPC's growth rate compare to its peers and the wider market? Dig deeper into the analyst consensus number for the upcoming years by interacting with our free analyst growth expectation chart.
- Other High Quality Alternatives: Do you like a good all-rounder? Explore our interactive list of high quality stocks to get an idea of what else is out there you may be missing!
PS. The Simply Wall St app conducts a discounted cash flow valuation for every stock on the NASDAQGS every day. If you want to find the calculation for other stocks just search here.
Valuation is complex, but we're here to simplify it.
Discover if Balchem might be undervalued or overvalued with our detailed analysis, featuring fair value estimates, potential risks, dividends, insider trades, and its financial condition.
Access Free AnalysisHave feedback on this article? Concerned about the content? Get in touch with us directly. Alternatively, email editorial-team (at) simplywallst.com.
This article by Simply Wall St is general in nature. We provide commentary based on historical data and analyst forecasts only using an unbiased methodology and our articles are not intended to be financial advice. It does not constitute a recommendation to buy or sell any stock, and does not take account of your objectives, or your financial situation. We aim to bring you long-term focused analysis driven by fundamental data. Note that our analysis may not factor in the latest price-sensitive company announcements or qualitative material. Simply Wall St has no position in any stocks mentioned.
About NasdaqGS:BCPC
Balchem
Develops, manufactures, and markets specialty performance ingredients and products for the nutritional, food, pharmaceutical, animal health, medical device sterilization, plant nutrition, and industrial markets worldwide.
Flawless balance sheet with solid track record.
Similar Companies
Market Insights

Advertisement
Community Narratives
A formidable player in AI and enterprise computing.
Fair Value US$210.00|0.7% overvalued
CO
Community Contributor
IREN's Bold Moves in Sustainable Bitcoin Mining & AI Data Centers
Fair Value US$72.52|14.9% undervalued
BL
Community Contributor
Cooling the Champions: The Aussie Tech Behind F1's Victories
Fair Value AU$12.40|38.1% undervalued
TR
Community Contributor