Advertisement
- United States
- /
- Insurance
- /
- NYSE:RGA
What Do Recent Gains Mean for RGA’s Long-Term Value in 2025?

Simply Wall St
Reviewed by Bailey Pemberton
Trying to figure out what to do with Reinsurance Group of America stock right now? You are not alone. Whether you are eyeing opportunities for growth or just want to know if it is the right time to get in (or out), the stock has given investors plenty to think about lately. After a bit of a rocky start to the year, RGA shares have started to show some renewed life, climbing 3.9% in the past week and 2.2% over the last month. Sure, the year-to-date return is still in the red at -8.3%, and the one-year return sits at -5.0%. However, taking a step back reveals long-term strength. The stock has doubled in value over the last five years with a 104.1% gain and delivered 59.0% over three years.
Some of that momentum has come as the industry itself faces shifts in risk perceptions and market demand, and while not every headline has moved the needle, there is a sense that investors are getting more comfortable with RGA's fundamentals. Now, here is the big question: is the company undervalued? According to a six-factor valuation score, RGA checks three boxes for being undervalued, which puts its value score at a respectable 3 out of 6. Of course, that is only part of the picture. Let’s dive deeper into those valuation methods and why a blend of approaches can give you a much clearer answer than any single score ever will.
Why Reinsurance Group of America is lagging behind its peers
Approach 1: Reinsurance Group of America Excess Returns Analysis
The Excess Returns model provides a clear picture of how well a company is able to generate returns above its cost of equity. This method focuses on the difference between what the company earns on its equity investments and what it would need to earn to compensate investors for the risk they take on. A higher excess return signals a stronger ability to create value beyond basic capital requirements.
For Reinsurance Group of America, the numbers paint a convincing picture. The company’s book value per share stands at $182.37 and its stable earnings per share are projected at $28.07, based on analyses from seven different equity analysts. The cost of equity is $14.31 per share, while the company’s average return on equity is 13.29%. This leads to a healthy excess return of $13.76 per share. Analysts expect the stable book value to reach $211.20 per share, according to future estimates from eight different sources. These figures suggest a strong track record of efficiently using shareholder capital to create value.
Based on the Excess Returns valuation, the intrinsic value of RGA is estimated to be 66.2% above its current share price, indicating that the stock is significantly undervalued.
Result: UNDERVALUED
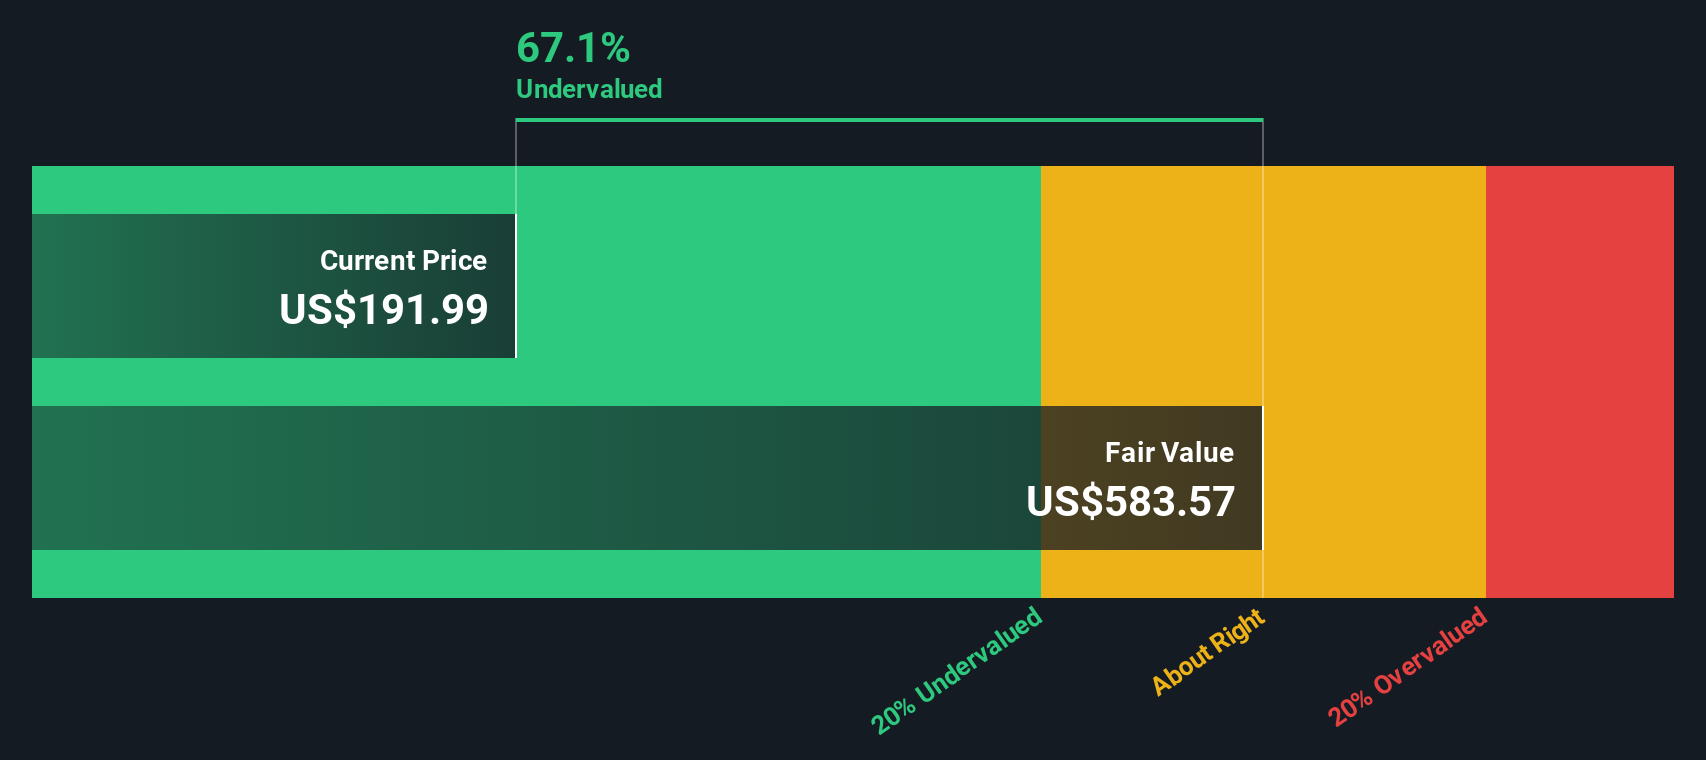
Our Excess Returns analysis suggests Reinsurance Group of America is undervalued by 66.2%. Track this in your watchlist or portfolio, or discover more undervalued stocks.
Approach 2: Reinsurance Group of America Price vs Earnings
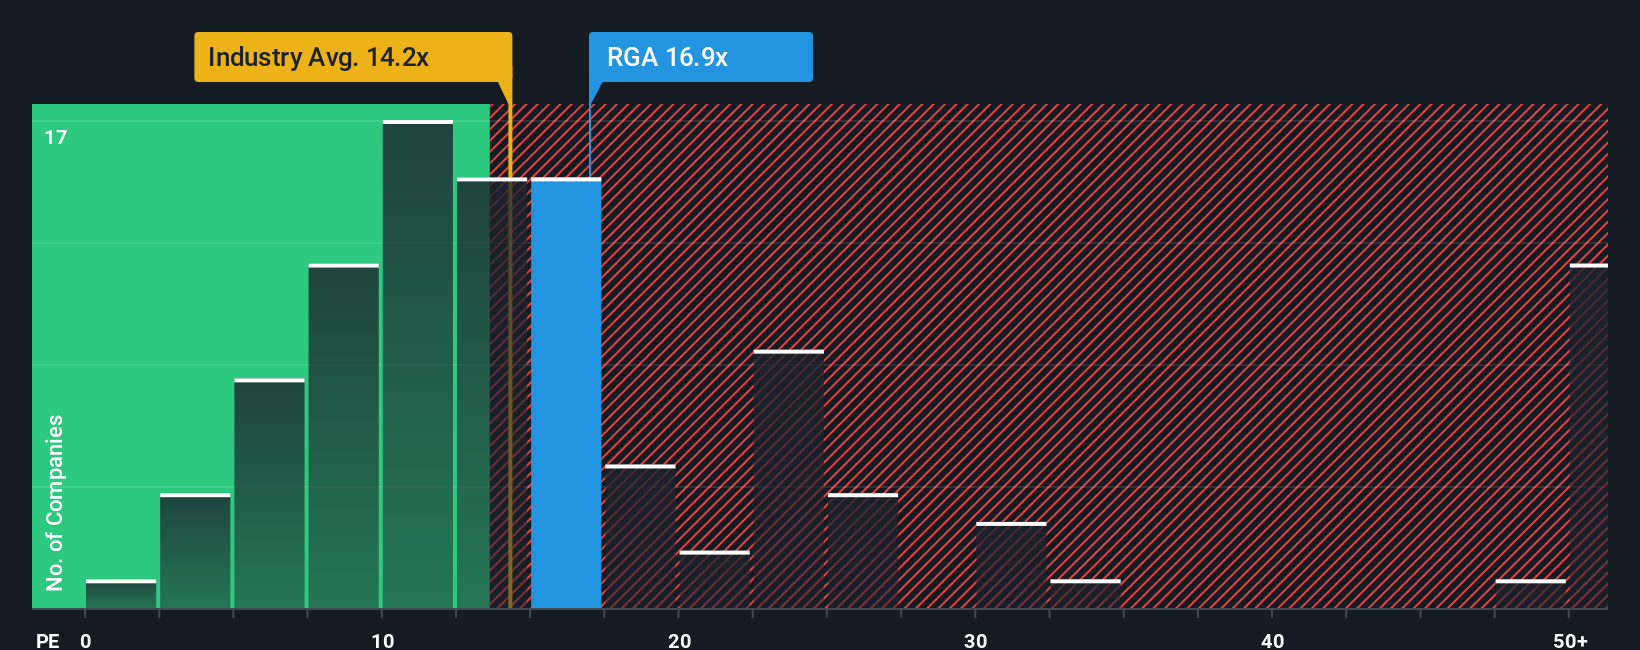
The price-to-earnings (PE) ratio is a popular and effective valuation metric for profitable companies like Reinsurance Group of America because it directly relates a company’s market value to its earnings. For investors, the PE ratio provides a straightforward snapshot of how much they are paying for each dollar of the company’s earnings, which makes it especially useful when assessing mature businesses with consistent profitability.
Of course, what counts as a “normal” PE depends not just on current profits, but also expectations for future growth and the degree of risk. Higher growth prospects and lower risk profiles often justify a premium, while slower-growing or riskier companies tend to command lower multiples. That means comparing RGA’s current PE ratio to its competitors and industry can reveal how the market views its prospects relative to others in the insurance space.
Right now, Reinsurance Group of America trades at a PE ratio of 16.95x. In comparison, the average PE ratio for global insurance peers stands at 14.26x, while the broader insurance industry average is 14.24x. At first glance, RGA’s higher multiple could suggest a premium valuation, possibly reflecting above-average earnings quality or growth expectations.
However, Simply Wall St’s proprietary “Fair Ratio,” which tailors the expected PE based on factors like RGA’s earnings growth, profitability, market cap, industry characteristics, and specific risks, places the fair value multiple at 20.98x. Unlike a simple peer or industry comparison, the Fair Ratio is designed to offer a more nuanced and holistic benchmark for valuation, adjusting for factors that matter most to long-term investors.
Comparing the Fair Ratio of 20.98x to RGA’s actual PE of 16.95x, the stock is trading below what would be expected based on its fundamentals. This indicates that, from a PE perspective, RGA currently appears undervalued relative to its own prospects and risk profile.
Result: UNDERVALUED
PE ratios tell one story, but what if the real opportunity lies elsewhere? Discover companies where insiders are betting big on explosive growth.
Upgrade Your Decision Making: Choose your Reinsurance Group of America Narrative
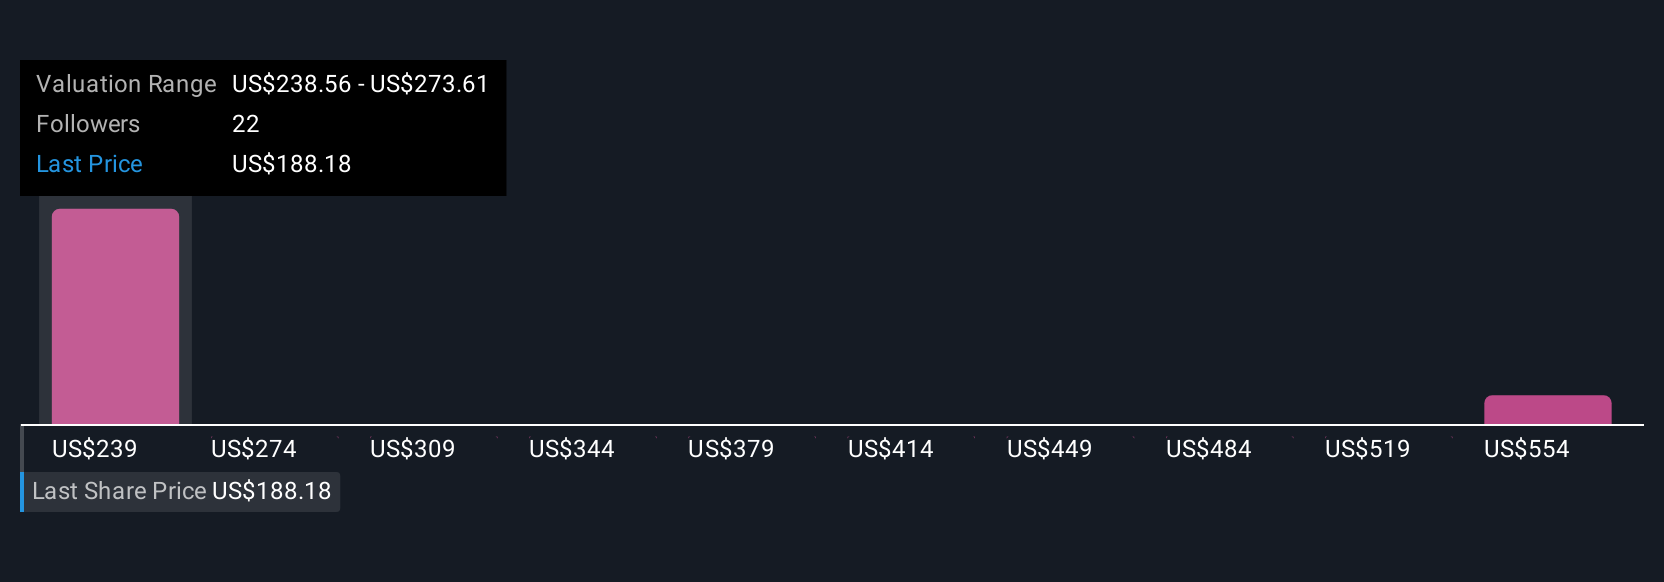
Earlier we mentioned that there is an even better way to understand valuation. Let us introduce you to Narratives. A Narrative is simply a story behind the numbers, where you bring your perspective on a company, such as your expectations for future revenue, profit margins, or market shifts, and connect that story directly to your financial forecast and fair value estimate for the stock.
Narratives bridge the gap between the company’s journey and the numbers by showing how your view of RGA’s future directly shapes your estimate of what it is really worth. On Simply Wall St’s Community page, millions of investors use Narratives to easily express their investment thesis, see how their outlook translates into a fair value, and compare that to the latest share price to decide if and when to buy or sell.
The power of Narratives is that they update dynamically as new information, such as fresh earnings or breaking news, comes in. This keeps your analysis relevant without further effort. For example, for Reinsurance Group of America, some investors have a bullish Narrative with a price target as high as $275.0, while others take a more cautious view at just $195.0, all based on differences in growth, earnings, or risk assumptions.
Do you think there's more to the story for Reinsurance Group of America? Create your own Narrative to let the Community know!
This article by Simply Wall St is general in nature. We provide commentary based on historical data and analyst forecasts only using an unbiased methodology and our articles are not intended to be financial advice. It does not constitute a recommendation to buy or sell any stock, and does not take account of your objectives, or your financial situation. We aim to bring you long-term focused analysis driven by fundamental data. Note that our analysis may not factor in the latest price-sensitive company announcements or qualitative material. Simply Wall St has no position in any stocks mentioned.
New: AI Stock Screener & Alerts
Our new AI Stock Screener scans the market every day to uncover opportunities.
• Dividend Powerhouses (3%+ Yield)
• Undervalued Small Caps with Insider Buying
• High growth Tech and AI Companies
Or build your own from over 50 metrics.
Have feedback on this article? Concerned about the content? Get in touch with us directly. Alternatively, email editorial-team@simplywallst.com
About NYSE:RGA
Reinsurance Group of America
Provides reinsurance and financial solutions.
Established dividend payer with adequate balance sheet.
Similar Companies
Market Insights

Advertisement
Community Narratives
The Next Phase of Energy Storage: How NeoVolta Is Tackling America’s Power Crunch
Fair Value US$7.50|30.4% undervalued
MA
Community Contributor
A formidable player in AI and enterprise computing.
Fair Value US$210.00|3.0% undervalued
CO
Community Contributor
IREN's Bold Moves in Sustainable Bitcoin Mining & AI Data Centers
Fair Value US$72.52|20.4% undervalued
BL
Community Contributor
Cooling the Champions: The Aussie Tech Behind F1's Victories
Fair Value AU$12.40|38.1% undervalued
TR
Community Contributor