- United States
- /
- Insurance
- /
- NYSE:MCY
How Does Mercury General’s 38% Rally Compare After Recent Earnings Surprise?

Reviewed by Bailey Pemberton
If you are wondering whether it is the right time to jump into Mercury General, you are not alone. The stock has been catching a lot of eyes with its recent momentum. Over the last year, Mercury General's share price has surged an impressive 38.3%. Even in just the past 30 days, the stock is up 10.6%, and if you zoom out further, the five-year gain is a remarkable 150.2%. That's not just steady growth; that's outperformance in action. For those watching the broader landscape, a 211.8% return over three years puts Mercury General in rare company, and a year-to-date return of 30.2% shows that bullish sentiment is rolling strong into this year as well.
Much of this renewed interest seems to coincide with shifts in the property and casualty insurance sector more broadly. As market participants weigh evolving risks and opportunities, such as regulatory signals and improved underwriting environments, the perception around Mercury General's long-term prospects has certainly warmed up.
But what about valuation? That is where things get even more interesting. When we run Mercury General through a basket of widely used valuation checks, it scores a 3 out of a possible 6, indicating the company appears undervalued on half of the major metrics. Is that enough to conclude it is a steal at today’s price, or should investors dig deeper before making a move? Let’s break down these valuation approaches one at a time. Stick around because at the end, we will cover an even more insightful way to gauge what Mercury General is really worth.
Approach 1: Mercury General Excess Returns Analysis
The Excess Returns model is designed to measure a company's ability to generate returns above its cost of equity. This approach reveals whether each dollar invested by shareholders is earning a premium by comparing return on invested capital, cost of equity, and the company’s ability to consistently generate value over time.
In the case of Mercury General, the company has an average Return on Equity of 6.01%, which results in a stable Earnings Per Share (EPS) of $1.74, based on the median over the last five years. The Book Value per share is $35.56, while the estimated cost of equity stands at $1.96 per share. The current Excess Return is negative at $-0.22 per share. This suggests that Mercury General’s returns have not exceeded what shareholders require for their investment risk in the recent past. The stable Book Value, calculated at $28.97 per share, further underlines the company’s historical performance baseline.
Based on these factors, the Excess Returns model estimates Mercury General’s intrinsic value as much lower than its current market price. With an implied discount of negative 273.3%, the stock appears to be trading substantially above what this valuation approach considers fair value.
Result: OVERVALUED
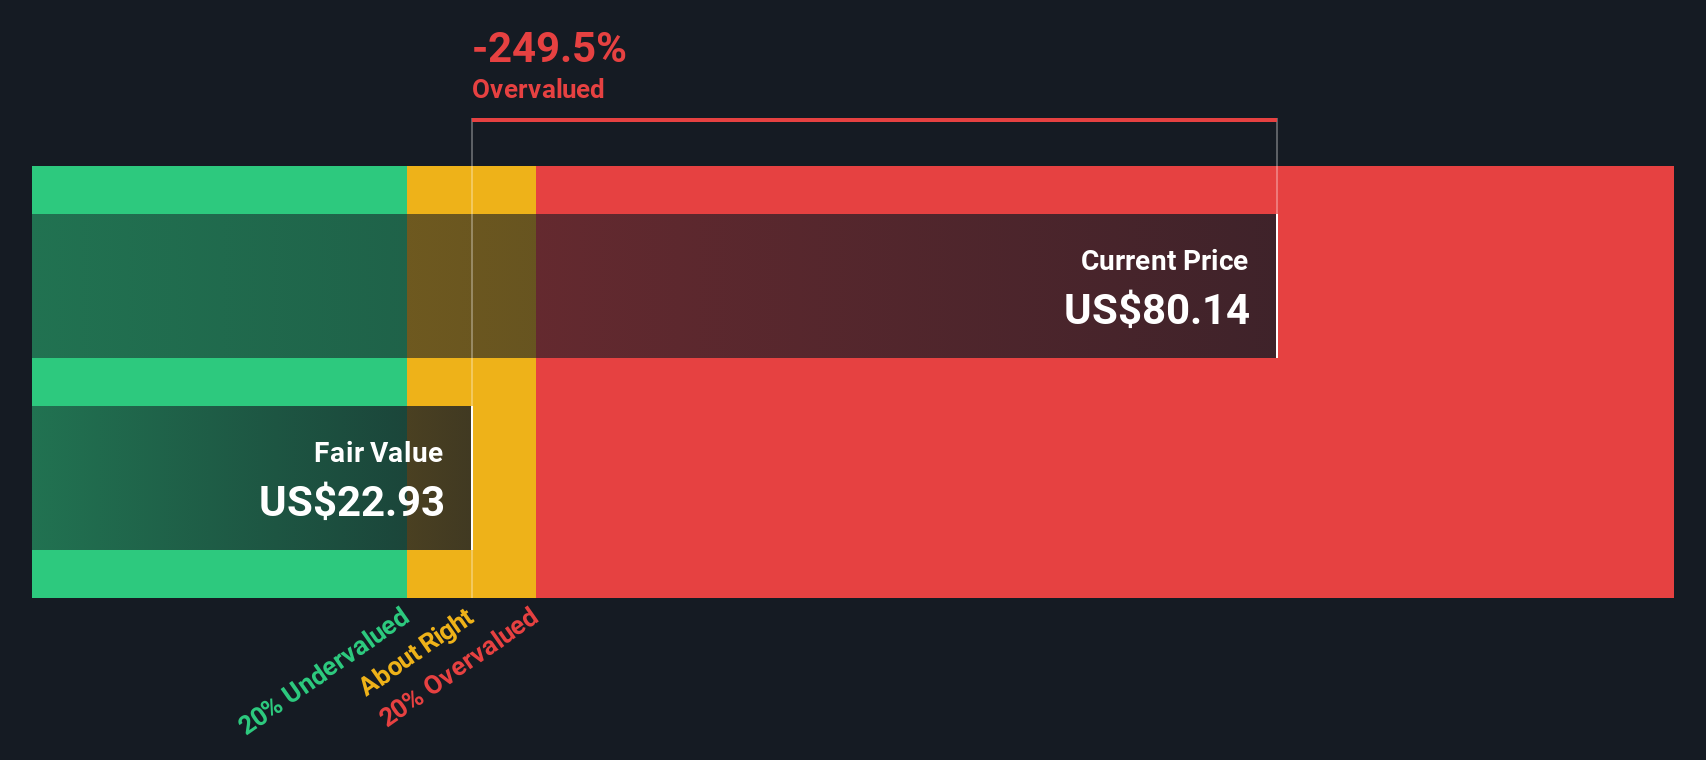
Our Excess Returns analysis suggests Mercury General may be overvalued by 273.3%. Find undervalued stocks or create your own screener to find better value opportunities.
Approach 2: Mercury General Price vs Earnings
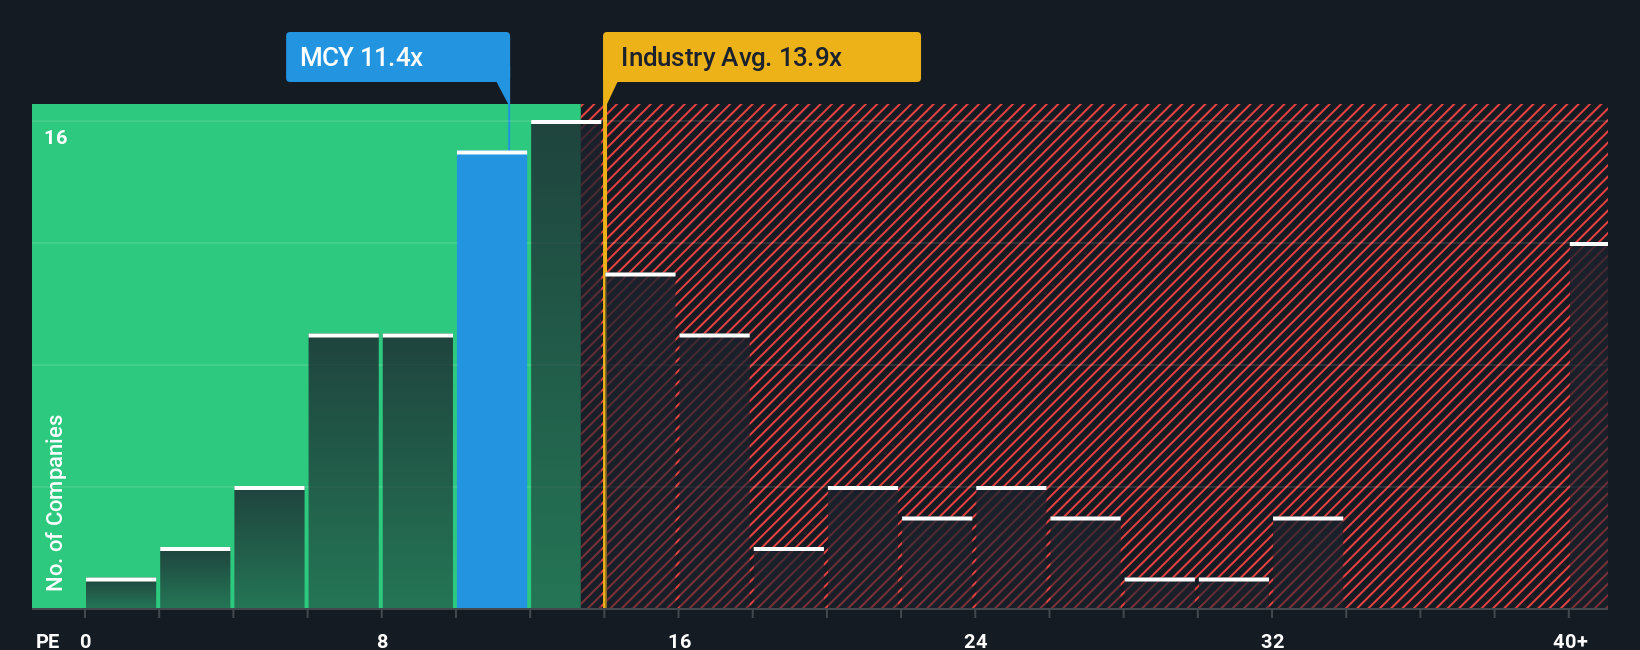
For profitable companies like Mercury General, the Price-to-Earnings (PE) ratio is a widely accepted way to value the business. The PE ratio puts the current share price in context with its earnings, giving investors a way to compare how markets value profitability across similar firms. Typically, higher expected growth or lower risk justifies a higher normal or “fair” PE ratio, as investors are willing to pay more for companies with better prospects or more certainty.
Currently, Mercury General trades at a PE ratio of 12.15x, which is below both the insurance industry average of 14.28x and its peer average at 16.13x. On the surface, this suggests that the stock may be undervalued based on these standard benchmarks. However, Simply Wall St’s Fair Ratio goes a step further by factoring in Mercury General’s growth outlook, profit margin, market capitalization, and specific risks. This delivers a more tailored view of what constitutes a fair valuation for this business.
The Simply Wall St Fair Ratio for Mercury General comes in at 13.11x. This proprietary metric is a more refined tool than comparing raw industry or peer averages, as it reflects the nuanced realities of Mercury General’s earnings growth, financial health, and risk profile. With the current PE ratio just 0.96x below this Fair Ratio, the data indicates that Mercury General is valued almost right in line with where you would expect, given the company’s unique characteristics.
Result: ABOUT RIGHT
PE ratios tell one story, but what if the real opportunity lies elsewhere? Discover companies where insiders are betting big on explosive growth.
Upgrade Your Decision Making: Choose your Mercury General Narrative
Earlier we mentioned there is an even better way to understand valuation, so let’s introduce you to Narratives. Narratives are a powerful and accessible approach where investors connect the company’s story, such as their personal assumptions for future revenue, earnings, and profit margins, to a financial forecast and an estimate of fair value. Instead of relying only on static analyst targets or simple ratios, Narratives let you actively craft your own perspective based on what you believe drives Mercury General's future.
Available right now to millions of investors on Simply Wall St’s Community page, Narratives transform investing into a dynamic experience. When news breaks or earnings are announced, Narratives update instantly, helping you continuously reassess whether Mercury General is overvalued or undervalued by comparing fair value to the current share price.
For example, if you believe Mercury General can grow revenue faster than consensus and maintain leading margins, your Narrative might justify a higher fair value than the market price. Conversely, someone concerned about reinsurance costs and wildfire risks may see a lower fair value. Whichever viewpoint you believe, Narratives empower you to make decisions with your own evidence and context, so you can invest with conviction, not just consensus.
Do you think there's more to the story for Mercury General? Create your own Narrative to let the Community know!
This article by Simply Wall St is general in nature. We provide commentary based on historical data and analyst forecasts only using an unbiased methodology and our articles are not intended to be financial advice. It does not constitute a recommendation to buy or sell any stock, and does not take account of your objectives, or your financial situation. We aim to bring you long-term focused analysis driven by fundamental data. Note that our analysis may not factor in the latest price-sensitive company announcements or qualitative material. Simply Wall St has no position in any stocks mentioned.
The New Payments ETF Is Live on NASDAQ:
Money is moving to real-time rails, and a newly listed ETF now gives investors direct exposure. Fast settlement. Institutional custody. Simple access.
Explore how this launch could reshape portfolios
Sponsored ContentNew: Manage All Your Stock Portfolios in One Place
We've created the ultimate portfolio companion for stock investors, and it's free.
• Connect an unlimited number of Portfolios and see your total in one currency
• Be alerted to new Warning Signs or Risks via email or mobile
• Track the Fair Value of your stocks
Have feedback on this article? Concerned about the content? Get in touch with us directly. Alternatively, email editorial-team@simplywallst.com
About NYSE:MCY
Mercury General
Engages in writing personal automobile insurance in the United States.
Adequate balance sheet and fair value.
Similar Companies
Market Insights

Weekly Picks

THE KINGDOM OF BROWN GOODS: WHY MGPI IS BEING CRUSHED BY INVENTORY & PRIMED FOR RESURRECTION


Why Vertical Aerospace (NYSE: EVTL) is Worth Possibly Over 13x its Current Price


The Quiet Giant That Became AI’s Power Grid
Recently Updated Narratives

Agfa-Gevaert is a digital and materials turnaround opportunity, with growth potential in ZIRFON, but carrying legacy risks.

Hitit Bilgisayar Hizmetleri will achieve a 19.7% revenue boost in the next five years


MINISO's fair value is projected at 26.69 with an anticipated PE ratio shift of 20x
Popular Narratives


MicroVision will explode future revenue by 380.37% with a vision towards success


Crazy Undervalued 42 Baggers Silver Play (Active & Running Mine)


