
Advertisement
- United States
- /
- Insurance
- /
- NYSE:HCI
Shareholders May Not Be So Generous With HCI Group, Inc.'s (NYSE:HCI) CEO Compensation And Here's Why
Performance at HCI Group, Inc. (NYSE:HCI) has been reasonably good and CEO Paresh Patel has done a decent job of steering the company in the right direction. As shareholders go into the upcoming AGM on 03 June 2021, CEO compensation will probably not be their focus, but rather the steps management will take to continue the growth momentum. However, some shareholders will still be cautious of paying the CEO excessively.
View our latest analysis for HCI Group
Comparing HCI Group, Inc.'s CEO Compensation With the industry
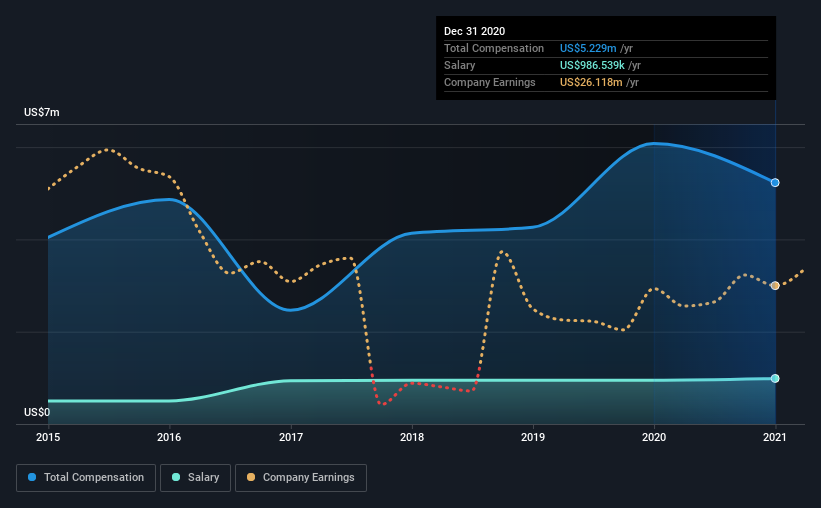
At the time of writing, our data shows that HCI Group, Inc. has a market capitalization of US$668m, and reported total annual CEO compensation of US$5.2m for the year to December 2020. We note that's a decrease of 14% compared to last year. While we always look at total compensation first, our analysis shows that the salary component is less, at US$987k.
For comparison, other companies in the same industry with market capitalizations ranging between US$400m and US$1.6b had a median total CEO compensation of US$2.6m. This suggests that Paresh Patel is paid more than the median for the industry. What's more, Paresh Patel holds US$66m worth of shares in the company in their own name, indicating that they have a lot of skin in the game.
| Component | 2020 | 2019 | Proportion (2020) |
| Salary | US$987k | US$950k | 19% |
| Other | US$4.2m | US$5.1m | 81% |
| Total Compensation | US$5.2m | US$6.1m | 100% |
Talking in terms of the industry, salary represented approximately 18% of total compensation out of all the companies we analyzed, while other remuneration made up 82% of the pie. There isn't a significant difference between HCI Group and the broader market, in terms of salary allocation in the overall compensation package. It's important to note that a slant towards non-salary compensation suggests that total pay is tied to the company's performance.
A Look at HCI Group, Inc.'s Growth Numbers
Over the past three years, HCI Group, Inc. has seen its earnings per share (EPS) grow by 46% per year. Its revenue is up 32% over the last year.
This demonstrates that the company has been improving recently and is good news for the shareholders. Most shareholders would be pleased to see strong revenue growth combined with EPS growth. This combo suggests a fast growing business. Moving away from current form for a second, it could be important to check this free visual depiction of what analysts expect for the future.
Has HCI Group, Inc. Been A Good Investment?
We think that the total shareholder return of 109%, over three years, would leave most HCI Group, Inc. shareholders smiling. This strong performance might mean some shareholders don't mind if the CEO were to be paid more than is normal for a company of its size.
To Conclude...
The company's decent performance might have made most shareholders happy, possibly making CEO remuneration the least of the concerns to be discussed in the upcoming AGM. However, if the board proposes to increase the compensation, some shareholders might have questions given that the CEO is already being paid higher than the industry.
CEO compensation is an important area to keep your eyes on, but we've also need to pay attention to other attributes of the company. In our study, we found 4 warning signs for HCI Group you should be aware of, and 1 of them is a bit unpleasant.
Arguably, business quality is much more important than CEO compensation levels. So check out this free list of interesting companies that have HIGH return on equity and low debt.
If you decide to trade HCI Group, use the lowest-cost* platform that is rated #1 Overall by Barron’s, Interactive Brokers. Trade stocks, options, futures, forex, bonds and funds on 135 markets, all from a single integrated account. Promoted
Valuation is complex, but we're here to simplify it.
Discover if HCI Group might be undervalued or overvalued with our detailed analysis, featuring fair value estimates, potential risks, dividends, insider trades, and its financial condition.
Access Free AnalysisThis article by Simply Wall St is general in nature. It does not constitute a recommendation to buy or sell any stock, and does not take account of your objectives, or your financial situation. We aim to bring you long-term focused analysis driven by fundamental data. Note that our analysis may not factor in the latest price-sensitive company announcements or qualitative material. Simply Wall St has no position in any stocks mentioned.
*Interactive Brokers Rated Lowest Cost Broker by StockBrokers.com Annual Online Review 2020
Have feedback on this article? Concerned about the content? Get in touch with us directly. Alternatively, email editorial-team (at) simplywallst.com.
About NYSE:HCI
HCI Group
Engages in the property and casualty insurance, insurance management, reinsurance, real estate, and information technology businesses in the United States.
Flawless balance sheet, good value and pays a dividend.
Similar Companies
Market Insights

Advertisement
Community Narratives
100% Patient Improvement in trial puts this $16M Biotech on the radar
Fair Value US$5.30|65.7% undervalued
JO
Community Contributor
Exxon Mobil's 17.5% Upside Promises Industry-Leading Returns in Energy Transition
Fair Value US$132.00|14.9% undervalued
HE
Community Contributor
NHC Analysis: Quality at a Good Price. A Golden Opportunity?
Fair Value US$179.80|35.4% undervalued
DA
Community Contributor
Product Refresh And Global Expansion Will Empower Future Market Leadership
Fair Value US$202.60|21.0% undervalued
AN
Based on Analyst Price Targets