- United States
- /
- Insurance
- /
- NYSE:FNF
What You Can Learn From Fidelity National Financial, Inc.'s (NYSE:FNF) P/S


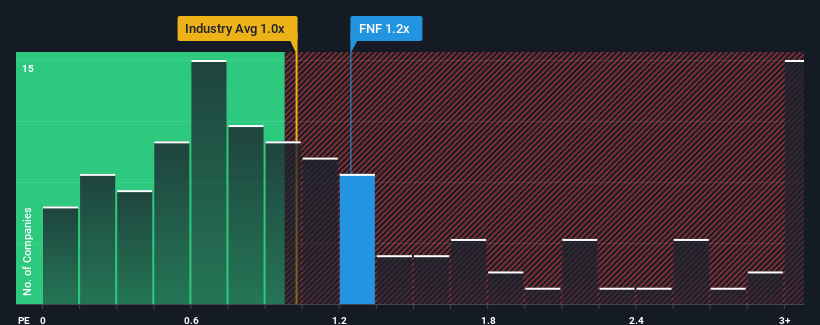
It's not a stretch to say that Fidelity National Financial, Inc.'s (NYSE:FNF) price-to-sales (or "P/S") ratio of 1.2x right now seems quite "middle-of-the-road" for companies in the Insurance industry in the United States, where the median P/S ratio is around 1x. Although, it's not wise to simply ignore the P/S without explanation as investors may be disregarding a distinct opportunity or a costly mistake.
View our latest analysis for Fidelity National Financial
How Fidelity National Financial Has Been Performing
While the industry has experienced revenue growth lately, Fidelity National Financial's revenue has gone into reverse gear, which is not great. Perhaps the market is expecting its poor revenue performance to improve, keeping the P/S from dropping. However, if this isn't the case, investors might get caught out paying too much for the stock.
Want the full picture on analyst estimates for the company? Then our free report on Fidelity National Financial will help you uncover what's on the horizon.How Is Fidelity National Financial's Revenue Growth Trending?
There's an inherent assumption that a company should be matching the industry for P/S ratios like Fidelity National Financial's to be considered reasonable.
Retrospectively, the last year delivered a frustrating 21% decrease to the company's top line. This has soured the latest three-year period, which nevertheless managed to deliver a decent 16% overall rise in revenue. Although it's been a bumpy ride, it's still fair to say the revenue growth recently has been mostly respectable for the company.
Turning to the outlook, the next year should generate growth of 8.3% as estimated by the four analysts watching the company. With the industry predicted to deliver 6.6% growth , the company is positioned for a comparable revenue result.
With this information, we can see why Fidelity National Financial is trading at a fairly similar P/S to the industry. It seems most investors are expecting to see average future growth and are only willing to pay a moderate amount for the stock.
The Bottom Line On Fidelity National Financial's P/S
We'd say the price-to-sales ratio's power isn't primarily as a valuation instrument but rather to gauge current investor sentiment and future expectations.
Our look at Fidelity National Financial's revenue growth estimates show that its P/S is about what we expect, as both metrics follow closely with the industry averages. At this stage investors feel the potential for an improvement or deterioration in revenue isn't great enough to push P/S in a higher or lower direction. All things considered, if the P/S and revenue estimates contain no major shocks, then it's hard to see the share price moving strongly in either direction in the near future.
You should always think about risks. Case in point, we've spotted 2 warning signs for Fidelity National Financial you should be aware of.
If these risks are making you reconsider your opinion on Fidelity National Financial, explore our interactive list of high quality stocks to get an idea of what else is out there.
If you're looking to trade Fidelity National Financial, open an account with the lowest-cost platform trusted by professionals, Interactive Brokers.
With clients in over 200 countries and territories, and access to 160 markets, IBKR lets you trade stocks, options, futures, forex, bonds and funds from a single integrated account.
Enjoy no hidden fees, no account minimums, and FX conversion rates as low as 0.03%, far better than what most brokers offer.
Sponsored ContentNew: AI Stock Screener & Alerts
Our new AI Stock Screener scans the market every day to uncover opportunities.
• Dividend Powerhouses (3%+ Yield)
• Undervalued Small Caps with Insider Buying
• High growth Tech and AI Companies
Or build your own from over 50 metrics.
Have feedback on this article? Concerned about the content? Get in touch with us directly. Alternatively, email editorial-team (at) simplywallst.com.
This article by Simply Wall St is general in nature. We provide commentary based on historical data and analyst forecasts only using an unbiased methodology and our articles are not intended to be financial advice. It does not constitute a recommendation to buy or sell any stock, and does not take account of your objectives, or your financial situation. We aim to bring you long-term focused analysis driven by fundamental data. Note that our analysis may not factor in the latest price-sensitive company announcements or qualitative material. Simply Wall St has no position in any stocks mentioned.
About NYSE:FNF
Fidelity National Financial
Provides various insurance products in the United States.
Established dividend payer with proven track record.

