- United States
- /
- Insurance
- /
- NYSE:FNF
Those who invested in Fidelity National Financial (NYSE:FNF) a year ago are up 43%


If you want to compound wealth in the stock market, you can do so by buying an index fund. But if you pick the right individual stocks, you could make more than that. To wit, the Fidelity National Financial, Inc. (NYSE:FNF) share price is 37% higher than it was a year ago, much better than the market return of around 22% (not including dividends) in the same period. So that should have shareholders smiling. However, the longer term returns haven't been so impressive, with the stock up just 25% in the last three years.
So let's investigate and see if the longer term performance of the company has been in line with the underlying business' progress.
Check out our latest analysis for Fidelity National Financial
To paraphrase Benjamin Graham: Over the short term the market is a voting machine, but over the long term it's a weighing machine. One flawed but reasonable way to assess how sentiment around a company has changed is to compare the earnings per share (EPS) with the share price.
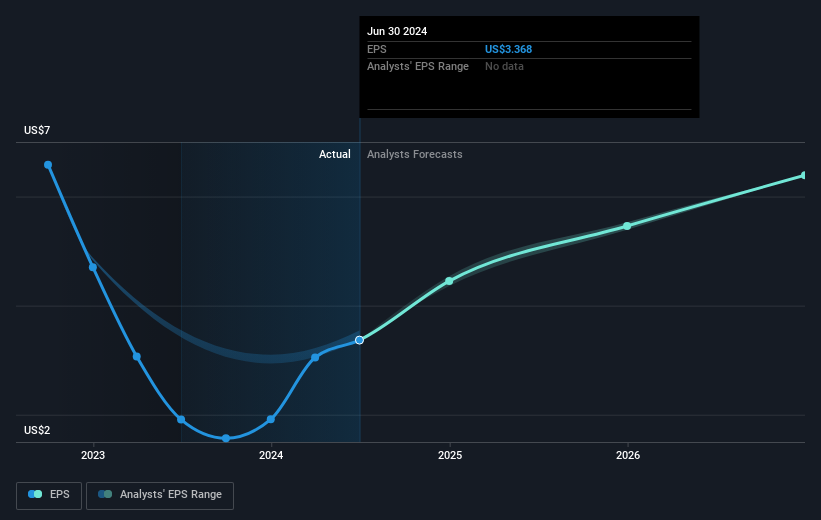
During the last year Fidelity National Financial grew its earnings per share (EPS) by 76%. This EPS growth is significantly higher than the 37% increase in the share price. Therefore, it seems the market isn't as excited about Fidelity National Financial as it was before. This could be an opportunity.
You can see how EPS has changed over time in the image below (click on the chart to see the exact values).
We know that Fidelity National Financial has improved its bottom line lately, but is it going to grow revenue? Check if analysts think Fidelity National Financial will grow revenue in the future.
What About Dividends?
It is important to consider the total shareholder return, as well as the share price return, for any given stock. Whereas the share price return only reflects the change in the share price, the TSR includes the value of dividends (assuming they were reinvested) and the benefit of any discounted capital raising or spin-off. So for companies that pay a generous dividend, the TSR is often a lot higher than the share price return. In the case of Fidelity National Financial, it has a TSR of 43% for the last 1 year. That exceeds its share price return that we previously mentioned. The dividends paid by the company have thusly boosted the total shareholder return.
A Different Perspective
It's nice to see that Fidelity National Financial shareholders have received a total shareholder return of 43% over the last year. And that does include the dividend. That's better than the annualised return of 11% over half a decade, implying that the company is doing better recently. Someone with an optimistic perspective could view the recent improvement in TSR as indicating that the business itself is getting better with time. I find it very interesting to look at share price over the long term as a proxy for business performance. But to truly gain insight, we need to consider other information, too. Consider for instance, the ever-present spectre of investment risk. We've identified 1 warning sign with Fidelity National Financial , and understanding them should be part of your investment process.
But note: Fidelity National Financial may not be the best stock to buy. So take a peek at this free list of interesting companies with past earnings growth (and further growth forecast).
Please note, the market returns quoted in this article reflect the market weighted average returns of stocks that currently trade on American exchanges.
New: AI Stock Screener & Alerts
Our new AI Stock Screener scans the market every day to uncover opportunities.
• Dividend Powerhouses (3%+ Yield)
• Undervalued Small Caps with Insider Buying
• High growth Tech and AI Companies
Or build your own from over 50 metrics.
Have feedback on this article? Concerned about the content? Get in touch with us directly. Alternatively, email editorial-team (at) simplywallst.com.
This article by Simply Wall St is general in nature. We provide commentary based on historical data and analyst forecasts only using an unbiased methodology and our articles are not intended to be financial advice. It does not constitute a recommendation to buy or sell any stock, and does not take account of your objectives, or your financial situation. We aim to bring you long-term focused analysis driven by fundamental data. Note that our analysis may not factor in the latest price-sensitive company announcements or qualitative material. Simply Wall St has no position in any stocks mentioned.
About NYSE:FNF
Fidelity National Financial
Provides various insurance products in the United States.
Established dividend payer with adequate balance sheet.

