
Advertisement
- United States
- /
- Personal Products
- /
- NasdaqCM:NHTC
The three-year decline in earnings for Natural Health Trends NASDAQ:NHTC) isn't encouraging, but shareholders are still up 17% over that period

In order to justify the effort of selecting individual stocks, it's worth striving to beat the returns from a market index fund. But the risk of stock picking is that you will likely buy under-performing companies. Unfortunately, that's been the case for longer term Natural Health Trends Corp. (NASDAQ:NHTC) shareholders, since the share price is down 20% in the last three years, falling well short of the market return of around 27%. Furthermore, it's down 19% in about a quarter. That's not much fun for holders.
If the past week is anything to go by, investor sentiment for Natural Health Trends isn't positive, so let's see if there's a mismatch between fundamentals and the share price.
View our latest analysis for Natural Health Trends
There is no denying that markets are sometimes efficient, but prices do not always reflect underlying business performance. One way to examine how market sentiment has changed over time is to look at the interaction between a company's share price and its earnings per share (EPS).
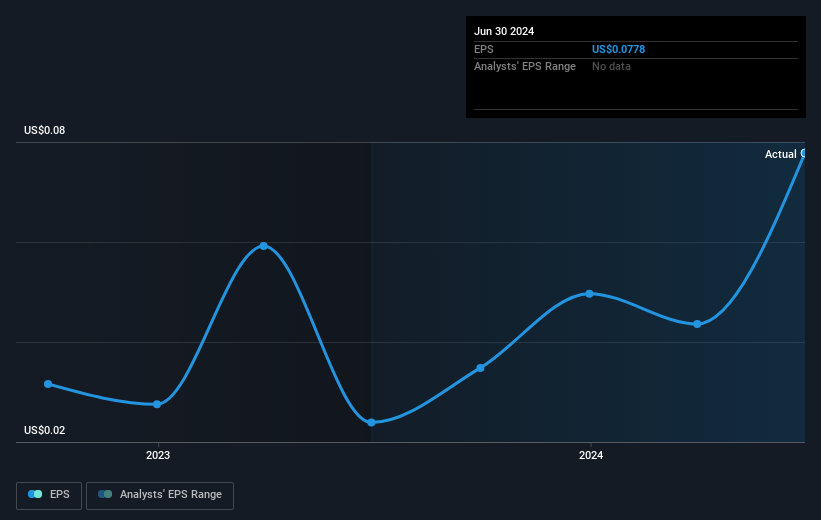
Natural Health Trends saw its EPS decline at a compound rate of 22% per year, over the last three years. In comparison the 7% compound annual share price decline isn't as bad as the EPS drop-off. So, despite the prior disappointment, shareholders must have some confidence the situation will improve, longer term. With a P/E ratio of 74.15, it's fair to say the market sees a brighter future for the business.
You can see how EPS has changed over time in the image below (click on the chart to see the exact values).
It might be well worthwhile taking a look at our free report on Natural Health Trends' earnings, revenue and cash flow.
What About Dividends?
When looking at investment returns, it is important to consider the difference between total shareholder return (TSR) and share price return. The TSR is a return calculation that accounts for the value of cash dividends (assuming that any dividend received was reinvested) and the calculated value of any discounted capital raisings and spin-offs. It's fair to say that the TSR gives a more complete picture for stocks that pay a dividend. We note that for Natural Health Trends the TSR over the last 3 years was 17%, which is better than the share price return mentioned above. This is largely a result of its dividend payments!
A Different Perspective
Natural Health Trends shareholders gained a total return of 23% during the year. Unfortunately this falls short of the market return. The silver lining is that the gain was actually better than the average annual return of 9% per year over five year. This could indicate that the company is winning over new investors, as it pursues its strategy. While it is well worth considering the different impacts that market conditions can have on the share price, there are other factors that are even more important. For example, we've discovered 3 warning signs for Natural Health Trends (2 shouldn't be ignored!) that you should be aware of before investing here.
Of course Natural Health Trends may not be the best stock to buy. So you may wish to see this free collection of growth stocks.
Please note, the market returns quoted in this article reflect the market weighted average returns of stocks that currently trade on American exchanges.
Valuation is complex, but we're here to simplify it.
Discover if Natural Health Trends might be undervalued or overvalued with our detailed analysis, featuring fair value estimates, potential risks, dividends, insider trades, and its financial condition.
Access Free AnalysisHave feedback on this article? Concerned about the content? Get in touch with us directly. Alternatively, email editorial-team (at) simplywallst.com.
This article by Simply Wall St is general in nature. We provide commentary based on historical data and analyst forecasts only using an unbiased methodology and our articles are not intended to be financial advice. It does not constitute a recommendation to buy or sell any stock, and does not take account of your objectives, or your financial situation. We aim to bring you long-term focused analysis driven by fundamental data. Note that our analysis may not factor in the latest price-sensitive company announcements or qualitative material. Simply Wall St has no position in any stocks mentioned.
About NasdaqCM:NHTC
Natural Health Trends
A direct-selling and e-commerce company, provides personal care, wellness, and lifestyle products under the NHT Global brand.
Flawless balance sheet with proven track record.
Similar Companies
Market Insights

Advertisement
Community Narratives
Pinterest will surge as advertising innovations ignite revenue growth
Fair Value US$42.63|26.1% undervalued
BR
Community Contributor
Brambles' Revenue Set to Climb 14% with Profit Margins Following
Fair Value AU$21.90|4.8% overvalued
RO
Community Contributor
Challenging Future for STG as Organic Sales Decline by 8.8%
Fair Value DKK 116.13|27.0% undervalued
KA
Community Contributor