
Advertisement
- United States
- /
- Medical Equipment
- /
- NasdaqGS:COO
Does Cooper Companies (NYSE:COO) Have A Healthy Balance Sheet?

The external fund manager backed by Berkshire Hathaway's Charlie Munger, Li Lu, makes no bones about it when he says 'The biggest investment risk is not the volatility of prices, but whether you will suffer a permanent loss of capital.' It's only natural to consider a company's balance sheet when you examine how risky it is, since debt is often involved when a business collapses. We can see that The Cooper Companies, Inc. (NYSE:COO) does use debt in its business. But the more important question is: how much risk is that debt creating?
When Is Debt A Problem?
Debt and other liabilities become risky for a business when it cannot easily fulfill those obligations, either with free cash flow or by raising capital at an attractive price. Part and parcel of capitalism is the process of 'creative destruction' where failed businesses are mercilessly liquidated by their bankers. However, a more common (but still painful) scenario is that it has to raise new equity capital at a low price, thus permanently diluting shareholders. Of course, the upside of debt is that it often represents cheap capital, especially when it replaces dilution in a company with the ability to reinvest at high rates of return. When we think about a company's use of debt, we first look at cash and debt together.
Check out our latest analysis for Cooper Companies
How Much Debt Does Cooper Companies Carry?
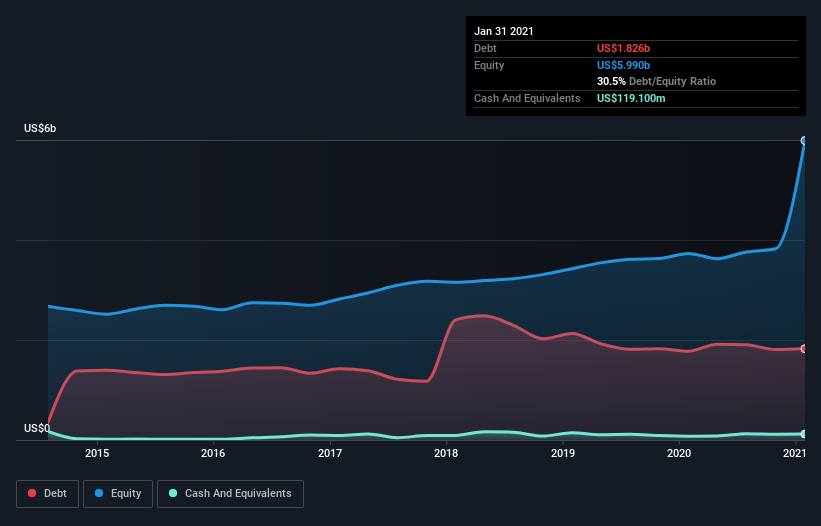
As you can see below, Cooper Companies had US$1.83b of debt, at January 2021, which is about the same as the year before. You can click the chart for greater detail. However, it does have US$119.1m in cash offsetting this, leading to net debt of about US$1.71b.
How Strong Is Cooper Companies' Balance Sheet?
We can see from the most recent balance sheet that Cooper Companies had liabilities of US$961.3m falling due within a year, and liabilities of US$1.97b due beyond that. Offsetting these obligations, it had cash of US$119.1m as well as receivables valued at US$461.2m due within 12 months. So its liabilities total US$2.35b more than the combination of its cash and short-term receivables.
Given Cooper Companies has a humongous market capitalization of US$19.9b, it's hard to believe these liabilities pose much threat. Having said that, it's clear that we should continue to monitor its balance sheet, lest it change for the worse.
We use two main ratios to inform us about debt levels relative to earnings. The first is net debt divided by earnings before interest, tax, depreciation, and amortization (EBITDA), while the second is how many times its earnings before interest and tax (EBIT) covers its interest expense (or its interest cover, for short). The advantage of this approach is that we take into account both the absolute quantum of debt (with net debt to EBITDA) and the actual interest expenses associated with that debt (with its interest cover ratio).
We'd say that Cooper Companies's moderate net debt to EBITDA ratio ( being 2.4), indicates prudence when it comes to debt. And its commanding EBIT of 13.3 times its interest expense, implies the debt load is as light as a peacock feather. Importantly, Cooper Companies's EBIT fell a jaw-dropping 27% in the last twelve months. If that earnings trend continues then paying off its debt will be about as easy as herding cats on to a roller coaster. The balance sheet is clearly the area to focus on when you are analysing debt. But it is future earnings, more than anything, that will determine Cooper Companies's ability to maintain a healthy balance sheet going forward. So if you're focused on the future you can check out this free report showing analyst profit forecasts.
Finally, a company can only pay off debt with cold hard cash, not accounting profits. So it's worth checking how much of that EBIT is backed by free cash flow. Over the most recent three years, Cooper Companies recorded free cash flow worth 78% of its EBIT, which is around normal, given free cash flow excludes interest and tax. This free cash flow puts the company in a good position to pay down debt, when appropriate.
Our View
The good news is that Cooper Companies's demonstrated ability to cover its interest expense with its EBIT delights us like a fluffy puppy does a toddler. But the stark truth is that we are concerned by its EBIT growth rate. It's also worth noting that Cooper Companies is in the Medical Equipment industry, which is often considered to be quite defensive. Looking at all the aforementioned factors together, it strikes us that Cooper Companies can handle its debt fairly comfortably. Of course, while this leverage can enhance returns on equity, it does bring more risk, so it's worth keeping an eye on this one. When analysing debt levels, the balance sheet is the obvious place to start. But ultimately, every company can contain risks that exist outside of the balance sheet. We've identified 3 warning signs with Cooper Companies (at least 2 which are a bit concerning) , and understanding them should be part of your investment process.
At the end of the day, it's often better to focus on companies that are free from net debt. You can access our special list of such companies (all with a track record of profit growth). It's free.
When trading Cooper Companies or any other investment, use the platform considered by many to be the Professional's Gateway to the Worlds Market, Interactive Brokers. You get the lowest-cost* trading on stocks, options, futures, forex, bonds and funds worldwide from a single integrated account. Promoted
New: AI Stock Screener & Alerts
Our new AI Stock Screener scans the market every day to uncover opportunities.
• Dividend Powerhouses (3%+ Yield)
• Undervalued Small Caps with Insider Buying
• High growth Tech and AI Companies
Or build your own from over 50 metrics.
This article by Simply Wall St is general in nature. It does not constitute a recommendation to buy or sell any stock, and does not take account of your objectives, or your financial situation. We aim to bring you long-term focused analysis driven by fundamental data. Note that our analysis may not factor in the latest price-sensitive company announcements or qualitative material. Simply Wall St has no position in any stocks mentioned.
*Interactive Brokers Rated Lowest Cost Broker by StockBrokers.com Annual Online Review 2020
Have feedback on this article? Concerned about the content? Get in touch with us directly. Alternatively, email editorial-team (at) simplywallst.com.
About NasdaqGS:COO
Cooper Companies
Develops, manufactures, and markets contact lens wearers.
Excellent balance sheet with proven track record.
Similar Companies
Market Insights

Advertisement
Community Narratives
Scaling up in building materials with smart M&A and growing profitability
Fair Value US$2.77|31.0% undervalued
CM
Community Contributor
Hims: The Platform Powering Personalised Healthcare
Fair Value US$114.01|53.1% undervalued
BL
Community Contributor
Undervalued lottery company with strong fundamentals
Fair Value AU$15.00|35.4% undervalued
RO
Community Contributor
Proximus, transferring money from the impatient to the patient investor
Fair Value €16.62|54.5% undervalued
AX
Community Contributor