- United States
- /
- Healthcare Services
- /
- NYSE:CI
Is The Cigna Group's (NYSE:CI) Stock Price Struggling As A Result Of Its Mixed Financials?


It is hard to get excited after looking at Cigna Group's (NYSE:CI) recent performance, when its stock has declined 9.6% over the past three months. It seems that the market might have completely ignored the positive aspects of the company's fundamentals and decided to weigh-in more on the negative aspects. Stock prices are usually driven by a company’s financial performance over the long term, and therefore we decided to pay more attention to the company's financial performance. In this article, we decided to focus on Cigna Group's ROE.
Return on equity or ROE is an important factor to be considered by a shareholder because it tells them how effectively their capital is being reinvested. Simply put, it is used to assess the profitability of a company in relation to its equity capital.
See our latest analysis for Cigna Group
How Do You Calculate Return On Equity?
Return on equity can be calculated by using the formula:
Return on Equity = Net Profit (from continuing operations) ÷ Shareholders' Equity
So, based on the above formula, the ROE for Cigna Group is:
9.2% = US$3.8b ÷ US$41b (Based on the trailing twelve months to December 2024).
The 'return' is the amount earned after tax over the last twelve months. That means that for every $1 worth of shareholders' equity, the company generated $0.09 in profit.
What Has ROE Got To Do With Earnings Growth?
We have already established that ROE serves as an efficient profit-generating gauge for a company's future earnings. Depending on how much of these profits the company reinvests or "retains", and how effectively it does so, we are then able to assess a company’s earnings growth potential. Assuming everything else remains unchanged, the higher the ROE and profit retention, the higher the growth rate of a company compared to companies that don't necessarily bear these characteristics.
Cigna Group's Earnings Growth And 9.2% ROE
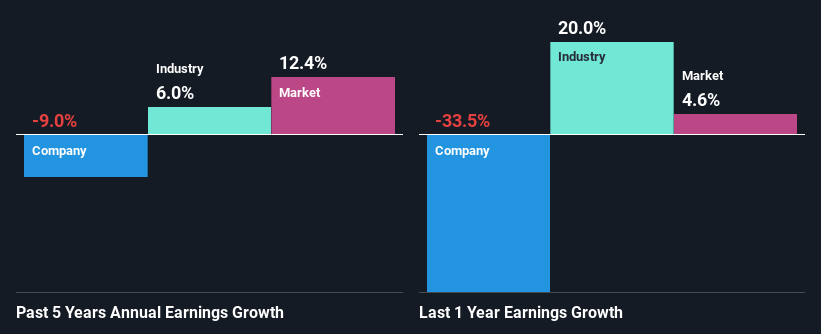
On the face of it, Cigna Group's ROE is not much to talk about. A quick further study shows that the company's ROE doesn't compare favorably to the industry average of 12% either. Given the circumstances, the significant decline in net income by 9.0% seen by Cigna Group over the last five years is not surprising. However, there could also be other factors causing the earnings to decline. For example, it is possible that the business has allocated capital poorly or that the company has a very high payout ratio.
However, when we compared Cigna Group's growth with the industry we found that while the company's earnings have been shrinking, the industry has seen an earnings growth of 6.0% in the same period. This is quite worrisome.
The basis for attaching value to a company is, to a great extent, tied to its earnings growth. The investor should try to establish if the expected growth or decline in earnings, whichever the case may be, is priced in. By doing so, they will have an idea if the stock is headed into clear blue waters or if swampy waters await. One good indicator of expected earnings growth is the P/E ratio which determines the price the market is willing to pay for a stock based on its earnings prospects. So, you may want to check if Cigna Group is trading on a high P/E or a low P/E, relative to its industry.
Is Cigna Group Using Its Retained Earnings Effectively?
In spite of a normal three-year median payout ratio of 25% (that is, a retention ratio of 75%), the fact that Cigna Group's earnings have shrunk is quite puzzling. So there could be some other explanations in that regard. For instance, the company's business may be deteriorating.
Additionally, Cigna Group has paid dividends over a period of at least ten years, which means that the company's management is determined to pay dividends even if it means little to no earnings growth. Existing analyst estimates suggest that the company's future payout ratio is expected to drop to 19% over the next three years. Accordingly, the expected drop in the payout ratio explains the expected increase in the company's ROE to 19%, over the same period.
Summary
On the whole, we feel that the performance shown by Cigna Group can be open to many interpretations. While the company does have a high rate of profit retention, its low rate of return is probably hampering its earnings growth. With that said, we studied the latest analyst forecasts and found that while the company has shrunk its earnings in the past, analysts expect its earnings to grow in the future. To know more about the latest analysts predictions for the company, check out this visualization of analyst forecasts for the company.
If you're looking to trade Cigna Group, open an account with the lowest-cost platform trusted by professionals, Interactive Brokers.
With clients in over 200 countries and territories, and access to 160 markets, IBKR lets you trade stocks, options, futures, forex, bonds and funds from a single integrated account.
Enjoy no hidden fees, no account minimums, and FX conversion rates as low as 0.03%, far better than what most brokers offer.
Sponsored ContentNew: AI Stock Screener & Alerts
Our new AI Stock Screener scans the market every day to uncover opportunities.
• Dividend Powerhouses (3%+ Yield)
• Undervalued Small Caps with Insider Buying
• High growth Tech and AI Companies
Or build your own from over 50 metrics.
Have feedback on this article? Concerned about the content? Get in touch with us directly. Alternatively, email editorial-team (at) simplywallst.com.
This article by Simply Wall St is general in nature. We provide commentary based on historical data and analyst forecasts only using an unbiased methodology and our articles are not intended to be financial advice. It does not constitute a recommendation to buy or sell any stock, and does not take account of your objectives, or your financial situation. We aim to bring you long-term focused analysis driven by fundamental data. Note that our analysis may not factor in the latest price-sensitive company announcements or qualitative material. Simply Wall St has no position in any stocks mentioned.
About NYSE:CI
Cigna Group
Provides insurance and related products and services in the United States.
Established dividend payer and fair value.
Similar Companies
Market Insights

Community Narratives

