- United States
- /
- Healthcare Services
- /
- NYSE:CI
Does Cigna Group’s Recent Gains Reflect Its Long Term Potential In 2025?

Reviewed by Bailey Pemberton
- Wondering if Cigna Group is quietly trading at a discount while everyone is distracted by flashier healthcare names? Let us unpack whether the current price really reflects its long term potential.
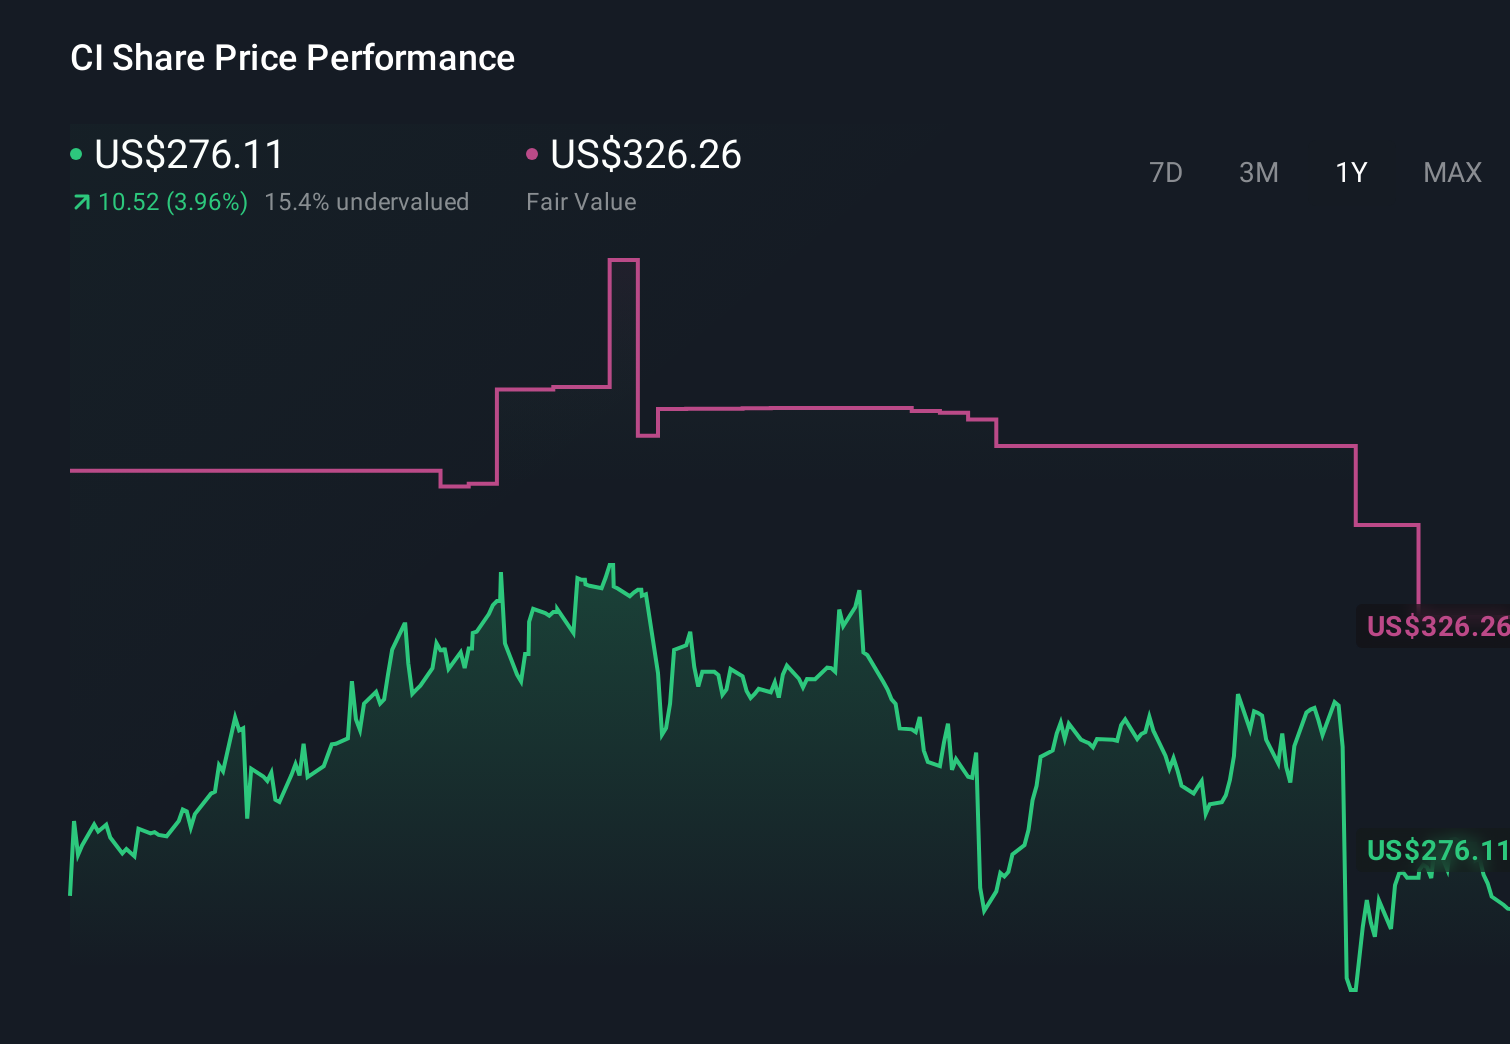
- The stock has climbed 5.1% over the last week and 2.4% over the past month, while it is up a modest 0.6% year to date and 6.1% over the last year, after a choppier 3 year stretch where it is still down 11.5% but ahead 54.8% over 5 years.
- Recent headlines have focused on Cigna Group’s strategic positioning in managed care and pharmacy benefits, as investors reassess which insurers are best placed to navigate changing healthcare policy and utilization trends. At the same time, sector wide debates around drug pricing, cost management, and consolidation have put a spotlight on which business models can defend margins through the cycle.
- On our framework, Cigna Group scores a 5/6 valuation check, which suggests it screens as undervalued on most of the metrics we track. Below, we walk through what that means using several different valuation lenses, then finish with a more holistic way to think about what the stock might be worth.
Approach 1: Cigna Group Discounted Cash Flow (DCF) Analysis
A Discounted Cash Flow, or DCF, model estimates what a company is worth today by projecting the cash it can generate in the future and discounting those cash flows back to the present.
For Cigna Group, the latest twelve month free cash flow is about $7.0 billion, and analysts expect this to climb steadily as the business scales. By 2029, projections point to free cash flow of roughly $11.2 billion, with further growth extrapolated out to 2035 using Simply Wall St assumptions once analyst coverage tapers off. These forward cash flows are discounted back using a 2 Stage Free Cash Flow to Equity framework, which reflects higher growth in the near term that slows over time.
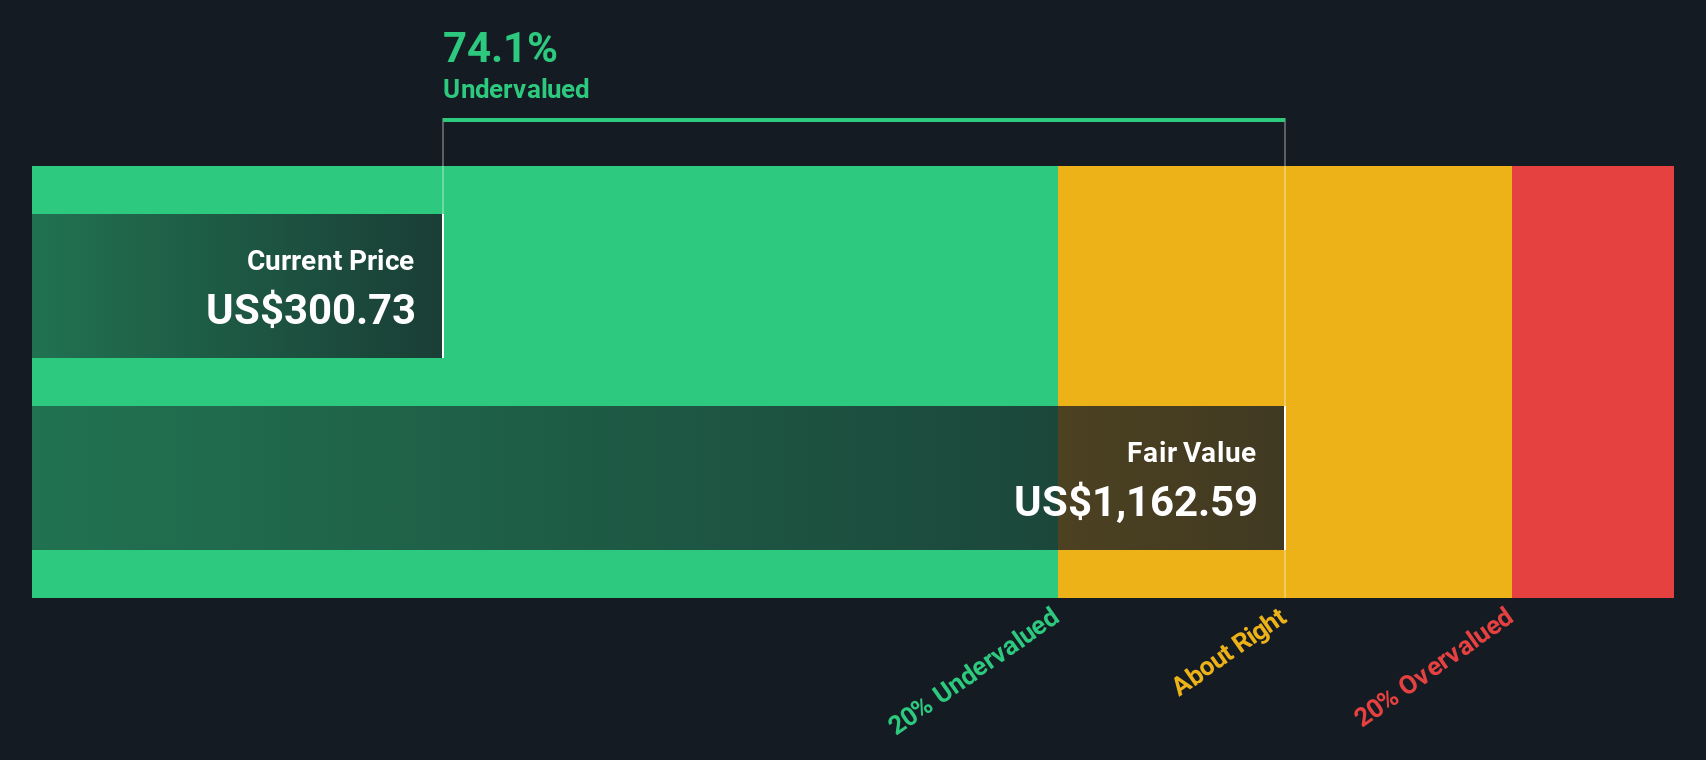
On this basis, the model suggests an intrinsic value of roughly $1,062 per share. Compared with the current market price, this implies Cigna Group could be trading at about a 74.0% discount to its estimated fair value, indicating a substantial valuation gap if the cash flow assumptions prove broadly accurate.
Result: UNDERVALUED
Our Discounted Cash Flow (DCF) analysis suggests Cigna Group is undervalued by 74.0%. Track this in your watchlist or portfolio, or discover 910 more undervalued stocks based on cash flows.
Approach 2: Cigna Group Price vs Earnings
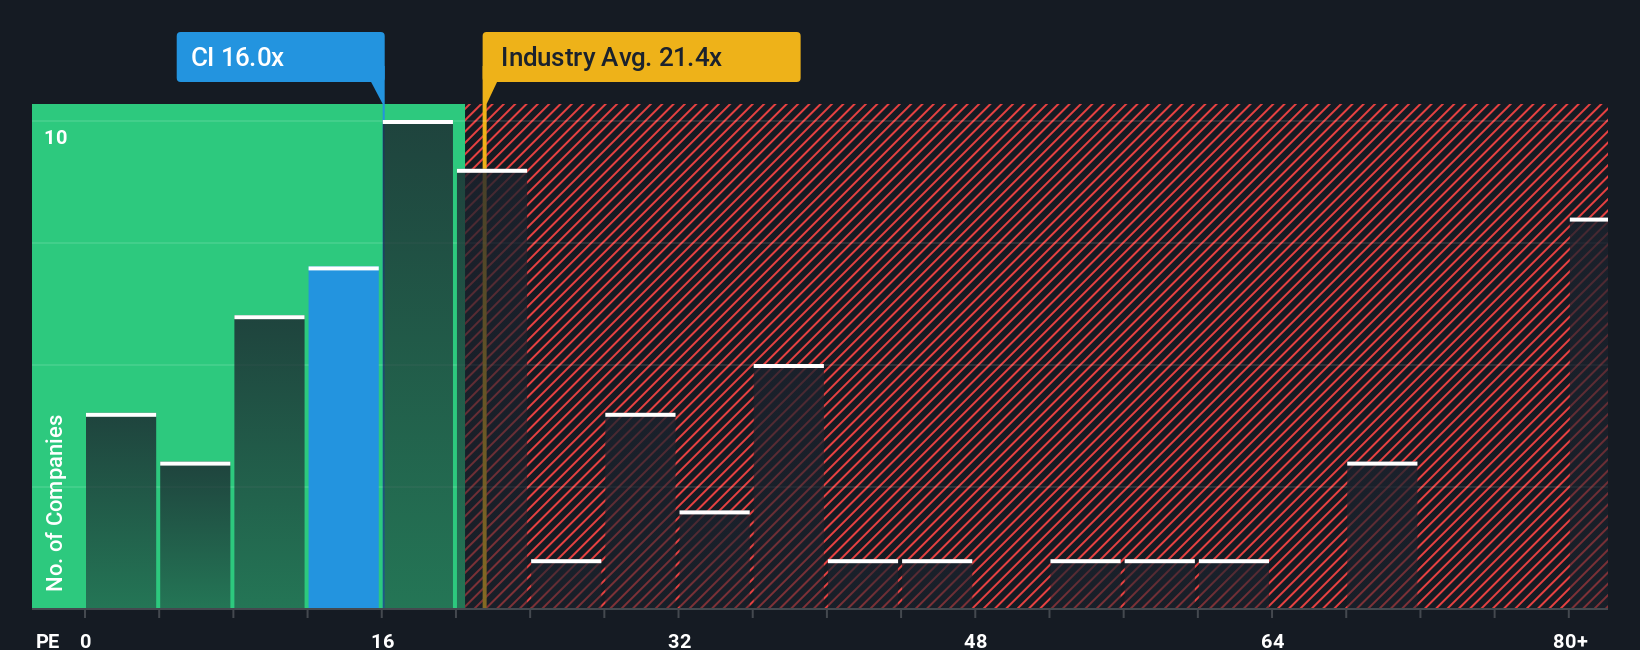
For profitable companies like Cigna Group, the price to earnings, or PE, ratio is a useful way to gauge how much investors are willing to pay for each dollar of current earnings. In general, faster growing and less risky businesses tend to justify a higher PE, while slower growth or higher uncertainty should translate into a lower, more conservative multiple.
Cigna Group currently trades on a PE of about 12.0x, which sits well below the broader Healthcare industry average of roughly 23.9x and also below the peer group average of around 31.2x. Simply Wall St’s proprietary Fair Ratio framework goes a step further by estimating what PE the stock might trade on, given its earnings growth outlook, industry, profit margins, market cap and risk profile. For Cigna Group, this Fair Ratio is estimated at about 28.0x, meaning the shares appear to trade at a substantial discount to what might be expected once these fundamentals are taken into account.
Result: UNDERVALUED
PE ratios tell one story, but what if the real opportunity lies elsewhere? Discover 1457 companies where insiders are betting big on explosive growth.
Upgrade Your Decision Making: Choose your Cigna Group Narrative
Earlier we mentioned that there is an even better way to understand valuation, so let us introduce you to Narratives, which are simply the stories investors tell about a company, backed up by their own assumptions for future revenue, earnings, margins and ultimately fair value.
Instead of looking at the numbers in isolation, a Narrative ties together what you believe about Cigna Group’s business, how that should translate into a financial forecast, and what that implies for a fair value estimate today.
On Simply Wall St, Narratives are an easy, accessible tool on the Community page that millions of investors use to compare their own story and fair value for a company to others, and to decide whether the current price makes it a buy, hold, or sell.
Because Narratives are dynamically updated when new information such as news, regulatory changes, earnings, or guidance comes in, your view of Cigna Group can evolve in real time without you rebuilding a model from scratch.
For example, one Cigna Group Narrative might lean bullish, expecting earnings to move toward the higher analyst range and justifying a fair value closer to the top end of price targets. A more cautious Narrative could emphasize regulatory and PBM risks, use more conservative earnings and multiples, and arrive nearer the low end of the range. Yet both investors can clearly see how their assumptions differ and what that means versus today’s share price.
Do you think there's more to the story for Cigna Group? Head over to our Community to see what others are saying!
This article by Simply Wall St is general in nature. We provide commentary based on historical data and analyst forecasts only using an unbiased methodology and our articles are not intended to be financial advice. It does not constitute a recommendation to buy or sell any stock, and does not take account of your objectives, or your financial situation. We aim to bring you long-term focused analysis driven by fundamental data. Note that our analysis may not factor in the latest price-sensitive company announcements or qualitative material. Simply Wall St has no position in any stocks mentioned.
Mobile Infrastructure for Defense and Disaster
The next wave in robotics isn't humanoid. Its fully autonomous towers delivering 5G, ISR, and radar in under 30 minutes, anywhere.
Get the investor briefing before the next round of contracts
Sponsored On Behalf of CiTechNew: AI Stock Screener & Alerts
Our new AI Stock Screener scans the market every day to uncover opportunities.
• Dividend Powerhouses (3%+ Yield)
• Undervalued Small Caps with Insider Buying
• High growth Tech and AI Companies
Or build your own from over 50 metrics.
Have feedback on this article? Concerned about the content? Get in touch with us directly. Alternatively, email editorial-team@simplywallst.com
About NYSE:CI
Cigna Group
Provides insurance and related products and services in the United States.
Undervalued established dividend payer.
Similar Companies
Market Insights

Weekly Picks

Early mover in a fast growing industry. Likely to experience share price volatility as they scale


A case for CA$31.80 (undiluted), aka 8,616% upside from CA$0.37 (an 86 bagger!).


Moderation and Stabilisation: HOLD: Fair Price based on a 4-year Cycle is $12.08
Recently Updated Narratives

A case for USD $14.81 per share based on book value. Be warned, this is a micro-cap dependent on a single mine.

Occidental Petroleum to Become Fairly Priced at $68.29 According to Future Projections

Agfa-Gevaert is a digital and materials turnaround opportunity, with growth potential in ZIRFON, but carrying legacy risks.
Popular Narratives


MicroVision will explode future revenue by 380.37% with a vision towards success


Crazy Undervalued 42 Baggers Silver Play (Active & Running Mine)


