- United States
- /
- Healthtech
- /
- NasdaqGM:LFMD
Does This Valuation Of LifeMD, Inc. (NASDAQ:LFMD) Imply Investors Are Overpaying?


Key Insights
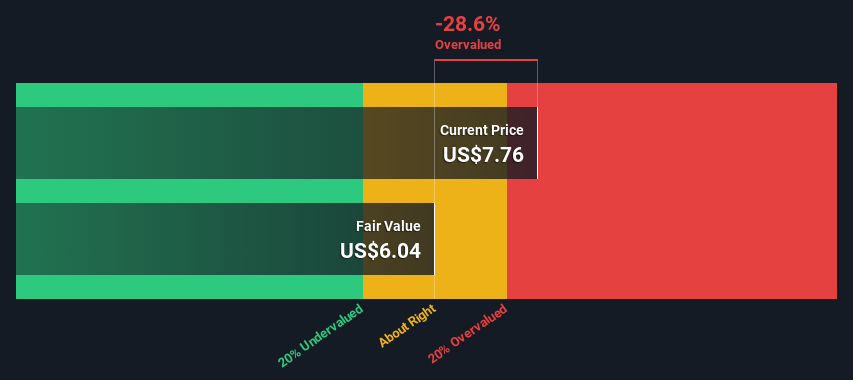
- Using the 2 Stage Free Cash Flow to Equity, LifeMD fair value estimate is US$6.04
- LifeMD's US$7.76 share price signals that it might be 29% overvalued
- Our fair value estimate is 41% lower than LifeMD's analyst price target of US$10.20
Today we will run through one way of estimating the intrinsic value of LifeMD, Inc. (NASDAQ:LFMD) by taking the expected future cash flows and discounting them to today's value. This will be done using the Discounted Cash Flow (DCF) model. Models like these may appear beyond the comprehension of a lay person, but they're fairly easy to follow.
We would caution that there are many ways of valuing a company and, like the DCF, each technique has advantages and disadvantages in certain scenarios. If you still have some burning questions about this type of valuation, take a look at the Simply Wall St analysis model.
See our latest analysis for LifeMD
Crunching The Numbers
We're using the 2-stage growth model, which simply means we take in account two stages of company's growth. In the initial period the company may have a higher growth rate and the second stage is usually assumed to have a stable growth rate. To begin with, we have to get estimates of the next ten years of cash flows. Where possible we use analyst estimates, but when these aren't available we extrapolate the previous free cash flow (FCF) from the last estimate or reported value. We assume companies with shrinking free cash flow will slow their rate of shrinkage, and that companies with growing free cash flow will see their growth rate slow, over this period. We do this to reflect that growth tends to slow more in the early years than it does in later years.
A DCF is all about the idea that a dollar in the future is less valuable than a dollar today, so we discount the value of these future cash flows to their estimated value in today's dollars:
10-year free cash flow (FCF) estimate
| 2024 | 2025 | 2026 | 2027 | 2028 | 2029 | 2030 | 2031 | 2032 | 2033 | |
| Levered FCF ($, Millions) | US$14.7m | US$13.6m | US$13.0m | US$12.7m | US$12.6m | US$12.6m | US$12.7m | US$12.8m | US$13.0m | US$13.2m |
| Growth Rate Estimate Source | Analyst x2 | Analyst x1 | Est @ -4.30% | Est @ -2.34% | Est @ -0.97% | Est @ -0.01% | Est @ 0.66% | Est @ 1.12% | Est @ 1.45% | Est @ 1.68% |
| Present Value ($, Millions) Discounted @ 7.2% | US$13.7 | US$11.9 | US$10.6 | US$9.7 | US$8.9 | US$8.3 | US$7.8 | US$7.4 | US$7.0 | US$6.6 |
("Est" = FCF growth rate estimated by Simply Wall St)
Present Value of 10-year Cash Flow (PVCF) = US$92m
We now need to calculate the Terminal Value, which accounts for all the future cash flows after this ten year period. The Gordon Growth formula is used to calculate Terminal Value at a future annual growth rate equal to the 5-year average of the 10-year government bond yield of 2.2%. We discount the terminal cash flows to today's value at a cost of equity of 7.2%.
Terminal Value (TV)= FCF2033 × (1 + g) ÷ (r – g) = US$13m× (1 + 2.2%) ÷ (7.2%– 2.2%) = US$274m
Present Value of Terminal Value (PVTV)= TV / (1 + r)10= US$274m÷ ( 1 + 7.2%)10= US$137m
The total value is the sum of cash flows for the next ten years plus the discounted terminal value, which results in the Total Equity Value, which in this case is US$229m. The last step is to then divide the equity value by the number of shares outstanding. Relative to the current share price of US$7.8, the company appears slightly overvalued at the time of writing. Remember though, that this is just an approximate valuation, and like any complex formula - garbage in, garbage out.
Important Assumptions
The calculation above is very dependent on two assumptions. The first is the discount rate and the other is the cash flows. Part of investing is coming up with your own evaluation of a company's future performance, so try the calculation yourself and check your own assumptions. The DCF also does not consider the possible cyclicality of an industry, or a company's future capital requirements, so it does not give a full picture of a company's potential performance. Given that we are looking at LifeMD as potential shareholders, the cost of equity is used as the discount rate, rather than the cost of capital (or weighted average cost of capital, WACC) which accounts for debt. In this calculation we've used 7.2%, which is based on a levered beta of 0.988. Beta is a measure of a stock's volatility, compared to the market as a whole. We get our beta from the industry average beta of globally comparable companies, with an imposed limit between 0.8 and 2.0, which is a reasonable range for a stable business.
SWOT Analysis for LifeMD
- No major strengths identified for LFMD.
- Shareholders have been diluted in the past year.
- Forecast to reduce losses next year.
- Good value based on P/S ratio compared to estimated Fair P/S ratio.
- Debt is not well covered by operating cash flow.
- Has less than 3 years of cash runway based on current free cash flow.
- Total liabilities exceed total assets, which raises the risk of financial distress.
- Not expected to become profitable over the next 3 years.
Moving On:
Whilst important, the DCF calculation is only one of many factors that you need to assess for a company. DCF models are not the be-all and end-all of investment valuation. Instead the best use for a DCF model is to test certain assumptions and theories to see if they would lead to the company being undervalued or overvalued. If a company grows at a different rate, or if its cost of equity or risk free rate changes sharply, the output can look very different. Why is the intrinsic value lower than the current share price? For LifeMD, we've compiled three important items you should consider:
- Risks: As an example, we've found 3 warning signs for LifeMD (1 is potentially serious!) that you need to consider before investing here.
- Future Earnings: How does LFMD's growth rate compare to its peers and the wider market? Dig deeper into the analyst consensus number for the upcoming years by interacting with our free analyst growth expectation chart.
- Other Solid Businesses: Low debt, high returns on equity and good past performance are fundamental to a strong business. Why not explore our interactive list of stocks with solid business fundamentals to see if there are other companies you may not have considered!
PS. Simply Wall St updates its DCF calculation for every American stock every day, so if you want to find the intrinsic value of any other stock just search here.
New: AI Stock Screener & Alerts
Our new AI Stock Screener scans the market every day to uncover opportunities.
• Dividend Powerhouses (3%+ Yield)
• Undervalued Small Caps with Insider Buying
• High growth Tech and AI Companies
Or build your own from over 50 metrics.
Have feedback on this article? Concerned about the content? Get in touch with us directly. Alternatively, email editorial-team (at) simplywallst.com.
This article by Simply Wall St is general in nature. We provide commentary based on historical data and analyst forecasts only using an unbiased methodology and our articles are not intended to be financial advice. It does not constitute a recommendation to buy or sell any stock, and does not take account of your objectives, or your financial situation. We aim to bring you long-term focused analysis driven by fundamental data. Note that our analysis may not factor in the latest price-sensitive company announcements or qualitative material. Simply Wall St has no position in any stocks mentioned.
About NasdaqGM:LFMD
LifeMD
Operates as a direct-to-patient telehealth company that connects consumers to healthcare professionals for medical care in the United States.
Undervalued with reasonable growth potential.
Similar Companies
Market Insights

Community Narratives
