- United States
- /
- Healthcare Services
- /
- NasdaqGM:FLGT
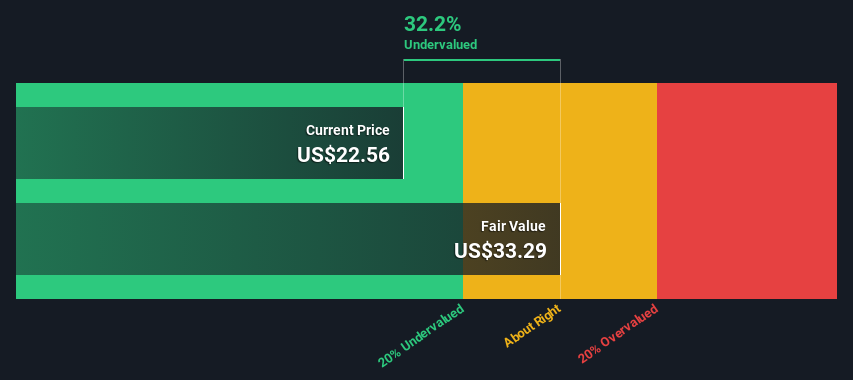
Are Investors Undervaluing Fulgent Genetics, Inc. (NASDAQ:FLGT) By 32%?


Key Insights
- Fulgent Genetics' estimated fair value is US$33.29 based on 2 Stage Free Cash Flow to Equity
- Fulgent Genetics' US$22.56 share price signals that it might be 32% undervalued
- The US$29.33 analyst price target for FLGT is 12% less than our estimate of fair value
Today we will run through one way of estimating the intrinsic value of Fulgent Genetics, Inc. (NASDAQ:FLGT) by projecting its future cash flows and then discounting them to today's value. We will use the Discounted Cash Flow (DCF) model on this occasion. It may sound complicated, but actually it is quite simple!
Remember though, that there are many ways to estimate a company's value, and a DCF is just one method. For those who are keen learners of equity analysis, the Simply Wall St analysis model here may be something of interest to you.
View our latest analysis for Fulgent Genetics
Is Fulgent Genetics Fairly Valued?
We're using the 2-stage growth model, which simply means we take in account two stages of company's growth. In the initial period the company may have a higher growth rate and the second stage is usually assumed to have a stable growth rate. To start off with, we need to estimate the next ten years of cash flows. Seeing as no analyst estimates of free cash flow are available to us, we have extrapolate the previous free cash flow (FCF) from the company's last reported value. We assume companies with shrinking free cash flow will slow their rate of shrinkage, and that companies with growing free cash flow will see their growth rate slow, over this period. We do this to reflect that growth tends to slow more in the early years than it does in later years.
Generally we assume that a dollar today is more valuable than a dollar in the future, so we discount the value of these future cash flows to their estimated value in today's dollars:
10-year free cash flow (FCF) forecast
| 2024 | 2025 | 2026 | 2027 | 2028 | 2029 | 2030 | 2031 | 2032 | 2033 | |
| Levered FCF ($, Millions) | US$34.1m | US$35.7m | US$37.0m | US$38.3m | US$39.4m | US$40.6m | US$41.6m | US$42.7m | US$43.7m | US$44.8m |
| Growth Rate Estimate Source | Est @ 5.41% | Est @ 4.47% | Est @ 3.82% | Est @ 3.36% | Est @ 3.04% | Est @ 2.81% | Est @ 2.66% | Est @ 2.55% | Est @ 2.47% | Est @ 2.42% |
| Present Value ($, Millions) Discounted @ 6.0% | US$32.2 | US$31.8 | US$31.1 | US$30.4 | US$29.5 | US$28.6 | US$27.7 | US$26.8 | US$26.0 | US$25.1 |
("Est" = FCF growth rate estimated by Simply Wall St)
Present Value of 10-year Cash Flow (PVCF) = US$289m
We now need to calculate the Terminal Value, which accounts for all the future cash flows after this ten year period. The Gordon Growth formula is used to calculate Terminal Value at a future annual growth rate equal to the 5-year average of the 10-year government bond yield of 2.3%. We discount the terminal cash flows to today's value at a cost of equity of 6.0%.
Terminal Value (TV)= FCF2033 × (1 + g) ÷ (r – g) = US$45m× (1 + 2.3%) ÷ (6.0%– 2.3%) = US$1.2b
Present Value of Terminal Value (PVTV)= TV / (1 + r)10= US$1.2b÷ ( 1 + 6.0%)10= US$697m
The total value, or equity value, is then the sum of the present value of the future cash flows, which in this case is US$987m. In the final step we divide the equity value by the number of shares outstanding. Relative to the current share price of US$22.6, the company appears quite good value at a 32% discount to where the stock price trades currently. Valuations are imprecise instruments though, rather like a telescope - move a few degrees and end up in a different galaxy. Do keep this in mind.
The Assumptions
Now the most important inputs to a discounted cash flow are the discount rate, and of course, the actual cash flows. Part of investing is coming up with your own evaluation of a company's future performance, so try the calculation yourself and check your own assumptions. The DCF also does not consider the possible cyclicality of an industry, or a company's future capital requirements, so it does not give a full picture of a company's potential performance. Given that we are looking at Fulgent Genetics as potential shareholders, the cost of equity is used as the discount rate, rather than the cost of capital (or weighted average cost of capital, WACC) which accounts for debt. In this calculation we've used 6.0%, which is based on a levered beta of 0.800. Beta is a measure of a stock's volatility, compared to the market as a whole. We get our beta from the industry average beta of globally comparable companies, with an imposed limit between 0.8 and 2.0, which is a reasonable range for a stable business.
SWOT Analysis for Fulgent Genetics
- Currently debt free.
- No major weaknesses identified for FLGT.
- Forecast to reduce losses next year.
- Has sufficient cash runway for more than 3 years based on current free cash flows.
- Trading below our estimate of fair value by more than 20%.
- Not expected to become profitable over the next 3 years.
Looking Ahead:
Whilst important, the DCF calculation is only one of many factors that you need to assess for a company. DCF models are not the be-all and end-all of investment valuation. Preferably you'd apply different cases and assumptions and see how they would impact the company's valuation. For example, changes in the company's cost of equity or the risk free rate can significantly impact the valuation. Why is the intrinsic value higher than the current share price? For Fulgent Genetics, we've put together three important aspects you should look at:
- Risks: We feel that you should assess the 1 warning sign for Fulgent Genetics we've flagged before making an investment in the company.
- Management:Have insiders been ramping up their shares to take advantage of the market's sentiment for FLGT's future outlook? Check out our management and board analysis with insights on CEO compensation and governance factors.
- Other High Quality Alternatives: Do you like a good all-rounder? Explore our interactive list of high quality stocks to get an idea of what else is out there you may be missing!
PS. Simply Wall St updates its DCF calculation for every American stock every day, so if you want to find the intrinsic value of any other stock just search here.
New: AI Stock Screener & Alerts
Our new AI Stock Screener scans the market every day to uncover opportunities.
• Dividend Powerhouses (3%+ Yield)
• Undervalued Small Caps with Insider Buying
• High growth Tech and AI Companies
Or build your own from over 50 metrics.
Have feedback on this article? Concerned about the content? Get in touch with us directly. Alternatively, email editorial-team (at) simplywallst.com.
This article by Simply Wall St is general in nature. We provide commentary based on historical data and analyst forecasts only using an unbiased methodology and our articles are not intended to be financial advice. It does not constitute a recommendation to buy or sell any stock, and does not take account of your objectives, or your financial situation. We aim to bring you long-term focused analysis driven by fundamental data. Note that our analysis may not factor in the latest price-sensitive company announcements or qualitative material. Simply Wall St has no position in any stocks mentioned.
About NasdaqGM:FLGT
Fulgent Genetics
Provides clinical diagnostic and therapeutic development solutions to physicians and patients in the United States and internationally.
Adequate balance sheet with concerning outlook.
Similar Companies
Market Insights

Community Narratives

