
Advertisement
Legendary fund manager Li Lu (who Charlie Munger backed) once said, 'The biggest investment risk is not the volatility of prices, but whether you will suffer a permanent loss of capital.' It's only natural to consider a company's balance sheet when you examine how risky it is, since debt is often involved when a business collapses. Importantly, Cerus Corporation (NASDAQ:CERS) does carry debt. But is this debt a concern to shareholders?
What Risk Does Debt Bring?
Generally speaking, debt only becomes a real problem when a company can't easily pay it off, either by raising capital or with its own cash flow. Ultimately, if the company can't fulfill its legal obligations to repay debt, shareholders could walk away with nothing. However, a more frequent (but still costly) occurrence is where a company must issue shares at bargain-basement prices, permanently diluting shareholders, just to shore up its balance sheet. Having said that, the most common situation is where a company manages its debt reasonably well - and to its own advantage. The first thing to do when considering how much debt a business uses is to look at its cash and debt together.
Check out our latest analysis for Cerus
What Is Cerus's Debt?
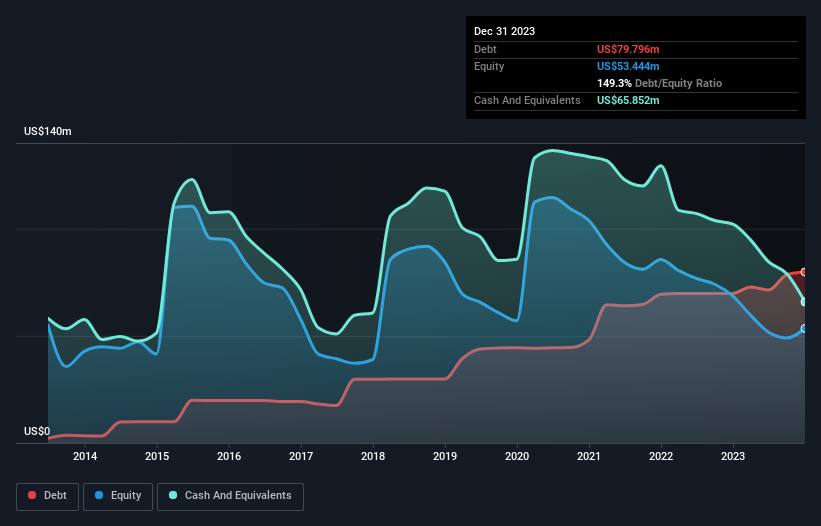
As you can see below, at the end of December 2023, Cerus had US$79.8m of debt, up from US$69.8m a year ago. Click the image for more detail. However, it does have US$65.9m in cash offsetting this, leading to net debt of about US$13.9m.
How Healthy Is Cerus' Balance Sheet?
According to the last reported balance sheet, Cerus had liabilities of US$67.5m due within 12 months, and liabilities of US$76.8m due beyond 12 months. Offsetting these obligations, it had cash of US$65.9m as well as receivables valued at US$35.5m due within 12 months. So its liabilities total US$43.0m more than the combination of its cash and short-term receivables.
Given Cerus has a market capitalization of US$309.1m, it's hard to believe these liabilities pose much threat. However, we do think it is worth keeping an eye on its balance sheet strength, as it may change over time. The balance sheet is clearly the area to focus on when you are analysing debt. But ultimately the future profitability of the business will decide if Cerus can strengthen its balance sheet over time. So if you're focused on the future you can check out this free report showing analyst profit forecasts.
Over 12 months, Cerus made a loss at the EBIT level, and saw its revenue drop to US$156m, which is a fall of 3.5%. That's not what we would hope to see.
Caveat Emptor
Importantly, Cerus had an earnings before interest and tax (EBIT) loss over the last year. To be specific the EBIT loss came in at US$26m. Considering that alongside the liabilities mentioned above does not give us much confidence that company should be using so much debt. Quite frankly we think the balance sheet is far from match-fit, although it could be improved with time. Another cause for caution is that is bled US$48m in negative free cash flow over the last twelve months. So suffice it to say we consider the stock very risky. When analysing debt levels, the balance sheet is the obvious place to start. However, not all investment risk resides within the balance sheet - far from it. To that end, you should be aware of the 3 warning signs we've spotted with Cerus .
At the end of the day, it's often better to focus on companies that are free from net debt. You can access our special list of such companies (all with a track record of profit growth). It's free.
New: AI Stock Screener & Alerts
Our new AI Stock Screener scans the market every day to uncover opportunities.
• Dividend Powerhouses (3%+ Yield)
• Undervalued Small Caps with Insider Buying
• High growth Tech and AI Companies
Or build your own from over 50 metrics.
Have feedback on this article? Concerned about the content? Get in touch with us directly. Alternatively, email editorial-team (at) simplywallst.com.
This article by Simply Wall St is general in nature. We provide commentary based on historical data and analyst forecasts only using an unbiased methodology and our articles are not intended to be financial advice. It does not constitute a recommendation to buy or sell any stock, and does not take account of your objectives, or your financial situation. We aim to bring you long-term focused analysis driven by fundamental data. Note that our analysis may not factor in the latest price-sensitive company announcements or qualitative material. Simply Wall St has no position in any stocks mentioned.
About NasdaqGM:CERS
Excellent balance sheet and good value.
Similar Companies
Market Insights


Advertisement
Community Narratives
100% Patient Improvement in trial puts this $16M Biotech on the radar
Fair Value US$5.30|78.1% undervalued
JO
Community Contributor
PayPal's Future Growth Through Venmo and Merchant Solutions
Fair Value US$105.25|33.3% undervalued
ZW
Community Contributor
IREN's Bold Moves in Sustainable Bitcoin Mining & AI Data Centers
Fair Value US$26.54|0.2% undervalued
BL
Community Contributor