- United States
- /
- Beverage
- /
- NYSE:KOF
Investing in Coca-Cola FEMSA. de (NYSE:KOF) three years ago would have delivered you a 99% gain

By buying an index fund, you can roughly match the market return with ease. But if you buy good businesses at attractive prices, your portfolio returns could exceed the average market return. Just take a look at Coca-Cola FEMSA, S.A.B. de C.V. (NYSE:KOF), which is up 72%, over three years, soundly beating the market return of 59% (not including dividends). On the other hand, the returns haven't been quite so good recently, with shareholders up just 54% , including dividends .
With that in mind, it's worth seeing if the company's underlying fundamentals have been the driver of long term performance, or if there are some discrepancies.
Check out our latest analysis for Coca-Cola FEMSA. de
To paraphrase Benjamin Graham: Over the short term the market is a voting machine, but over the long term it's a weighing machine. One flawed but reasonable way to assess how sentiment around a company has changed is to compare the earnings per share (EPS) with the share price.
During three years of share price growth, Coca-Cola FEMSA. de achieved compound earnings per share growth of 16% per year. We don't think it is entirely coincidental that the EPS growth is reasonably close to the 20% average annual increase in the share price. This suggests that sentiment and expectations have not changed drastically. Quite to the contrary, the share price has arguably reflected the EPS growth.
You can see how EPS has changed over time in the image below (click on the chart to see the exact values).
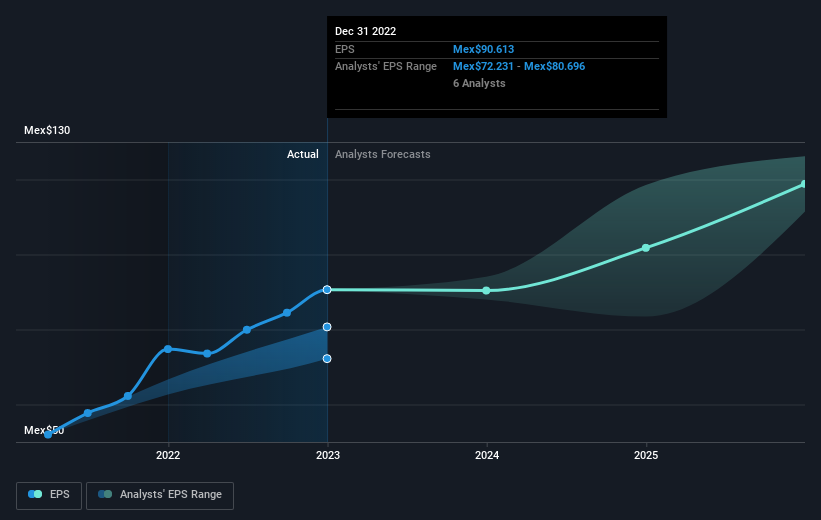
We know that Coca-Cola FEMSA. de has improved its bottom line lately, but is it going to grow revenue? Check if analysts think Coca-Cola FEMSA. de will grow revenue in the future.
What About Dividends?
As well as measuring the share price return, investors should also consider the total shareholder return (TSR). Whereas the share price return only reflects the change in the share price, the TSR includes the value of dividends (assuming they were reinvested) and the benefit of any discounted capital raising or spin-off. So for companies that pay a generous dividend, the TSR is often a lot higher than the share price return. We note that for Coca-Cola FEMSA. de the TSR over the last 3 years was 99%, which is better than the share price return mentioned above. This is largely a result of its dividend payments!
A Different Perspective
It's good to see that Coca-Cola FEMSA. de has rewarded shareholders with a total shareholder return of 54% in the last twelve months. Of course, that includes the dividend. That gain is better than the annual TSR over five years, which is 7%. Therefore it seems like sentiment around the company has been positive lately. Given the share price momentum remains strong, it might be worth taking a closer look at the stock, lest you miss an opportunity. Before forming an opinion on Coca-Cola FEMSA. de you might want to consider the cold hard cash it pays as a dividend. This free chart tracks its dividend over time.
If you would prefer to check out another company -- one with potentially superior financials -- then do not miss this free list of companies that have proven they can grow earnings.
Please note, the market returns quoted in this article reflect the market weighted average returns of stocks that currently trade on US exchanges.
If you're looking to trade Coca-Cola FEMSA. de, open an account with the lowest-cost platform trusted by professionals, Interactive Brokers.
With clients in over 200 countries and territories, and access to 160 markets, IBKR lets you trade stocks, options, futures, forex, bonds and funds from a single integrated account.
Enjoy no hidden fees, no account minimums, and FX conversion rates as low as 0.03%, far better than what most brokers offer.
Sponsored ContentNew: AI Stock Screener & Alerts
Our new AI Stock Screener scans the market every day to uncover opportunities.
• Dividend Powerhouses (3%+ Yield)
• Undervalued Small Caps with Insider Buying
• High growth Tech and AI Companies
Or build your own from over 50 metrics.
Have feedback on this article? Concerned about the content? Get in touch with us directly. Alternatively, email editorial-team (at) simplywallst.com.
This article by Simply Wall St is general in nature. We provide commentary based on historical data and analyst forecasts only using an unbiased methodology and our articles are not intended to be financial advice. It does not constitute a recommendation to buy or sell any stock, and does not take account of your objectives, or your financial situation. We aim to bring you long-term focused analysis driven by fundamental data. Note that our analysis may not factor in the latest price-sensitive company announcements or qualitative material. Simply Wall St has no position in any stocks mentioned.
About NYSE:KOF
Coca-Cola FEMSA. de
A franchise bottler, produces, markets, sells, and distributes Coca-Cola trademark beverages in Mexico, Guatemala, Nicaragua, Costa Rica, Panama, Colombia, Brazil, Argentina, and Uruguay.
Undervalued with solid track record and pays a dividend.
Similar Companies
Market Insights

Community Narratives

