
Advertisement
- United States
- /
- Food
- /
- NYSE:AGRO
Adecoagro S.A. (NYSE:AGRO) Shares Could Be 45% Below Their Intrinsic Value Estimate

Key Insights
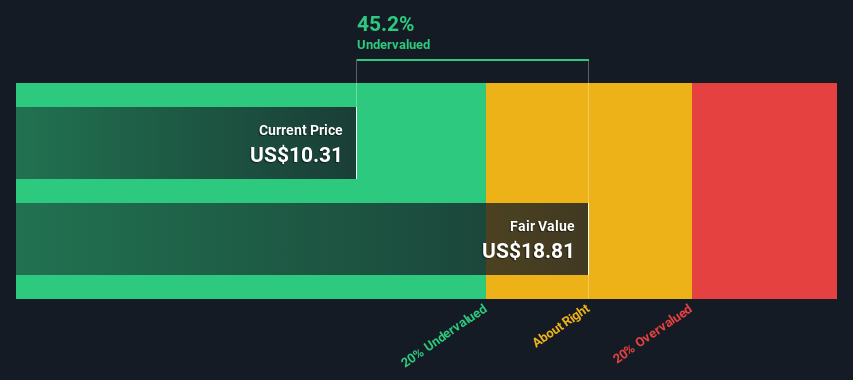
- Adecoagro's estimated fair value is US$18.81 based on 2 Stage Free Cash Flow to Equity
- Adecoagro is estimated to be 45% undervalued based on current share price of US$10.31
- The US$13.67 analyst price target for AGRO is 27% less than our estimate of fair value
How far off is Adecoagro S.A. (NYSE:AGRO) from its intrinsic value? Using the most recent financial data, we'll take a look at whether the stock is fairly priced by taking the expected future cash flows and discounting them to their present value. This will be done using the Discounted Cash Flow (DCF) model. Believe it or not, it's not too difficult to follow, as you'll see from our example!
Remember though, that there are many ways to estimate a company's value, and a DCF is just one method. If you want to learn more about discounted cash flow, the rationale behind this calculation can be read in detail in the Simply Wall St analysis model.
See our latest analysis for Adecoagro
The Method
We're using the 2-stage growth model, which simply means we take in account two stages of company's growth. In the initial period the company may have a higher growth rate and the second stage is usually assumed to have a stable growth rate. In the first stage we need to estimate the cash flows to the business over the next ten years. Where possible we use analyst estimates, but when these aren't available we extrapolate the previous free cash flow (FCF) from the last estimate or reported value. We assume companies with shrinking free cash flow will slow their rate of shrinkage, and that companies with growing free cash flow will see their growth rate slow, over this period. We do this to reflect that growth tends to slow more in the early years than it does in later years.
Generally we assume that a dollar today is more valuable than a dollar in the future, and so the sum of these future cash flows is then discounted to today's value:
10-year free cash flow (FCF) estimate
| 2025 | 2026 | 2027 | 2028 | 2029 | 2030 | 2031 | 2032 | 2033 | 2034 | |
| Levered FCF ($, Millions) | US$188.5m | US$181.5m | US$131.0m | US$104.7m | US$90.8m | US$83.0m | US$78.6m | US$76.4m | US$75.4m | US$75.2m |
| Growth Rate Estimate Source | Analyst x2 | Analyst x2 | Analyst x1 | Est @ -20.08% | Est @ -13.30% | Est @ -8.56% | Est @ -5.24% | Est @ -2.92% | Est @ -1.29% | Est @ -0.16% |
| Present Value ($, Millions) Discounted @ 6.3% | US$177 | US$161 | US$109 | US$82.1 | US$67.0 | US$57.7 | US$51.4 | US$47.0 | US$43.6 | US$41.0 |
("Est" = FCF growth rate estimated by Simply Wall St)
Present Value of 10-year Cash Flow (PVCF) = US$837m
After calculating the present value of future cash flows in the initial 10-year period, we need to calculate the Terminal Value, which accounts for all future cash flows beyond the first stage. For a number of reasons a very conservative growth rate is used that cannot exceed that of a country's GDP growth. In this case we have used the 5-year average of the 10-year government bond yield (2.5%) to estimate future growth. In the same way as with the 10-year 'growth' period, we discount future cash flows to today's value, using a cost of equity of 6.3%.
Terminal Value (TV)= FCF2034 × (1 + g) ÷ (r – g) = US$75m× (1 + 2.5%) ÷ (6.3%– 2.5%) = US$2.1b
Present Value of Terminal Value (PVTV)= TV / (1 + r)10= US$2.1b÷ ( 1 + 6.3%)10= US$1.1b
The total value, or equity value, is then the sum of the present value of the future cash flows, which in this case is US$2.0b. In the final step we divide the equity value by the number of shares outstanding. Relative to the current share price of US$10.3, the company appears quite good value at a 45% discount to where the stock price trades currently. Remember though, that this is just an approximate valuation, and like any complex formula - garbage in, garbage out.
Important Assumptions
We would point out that the most important inputs to a discounted cash flow are the discount rate and of course the actual cash flows. You don't have to agree with these inputs, I recommend redoing the calculations yourself and playing with them. The DCF also does not consider the possible cyclicality of an industry, or a company's future capital requirements, so it does not give a full picture of a company's potential performance. Given that we are looking at Adecoagro as potential shareholders, the cost of equity is used as the discount rate, rather than the cost of capital (or weighted average cost of capital, WACC) which accounts for debt. In this calculation we've used 6.3%, which is based on a levered beta of 0.913. Beta is a measure of a stock's volatility, compared to the market as a whole. We get our beta from the industry average beta of globally comparable companies, with an imposed limit between 0.8 and 2.0, which is a reasonable range for a stable business.
SWOT Analysis for Adecoagro
Strength
- Earnings growth over the past year exceeded the industry.
- Debt is well covered by earnings and cashflows.
- Dividends are covered by earnings and cash flows.
Weakness
- Dividend is low compared to the top 25% of dividend payers in the Food market.
Opportunity
- Good value based on P/E ratio and estimated fair value.
Threat
- Annual earnings are forecast to decline for the next 3 years.
Moving On:
Whilst important, the DCF calculation ideally won't be the sole piece of analysis you scrutinize for a company. DCF models are not the be-all and end-all of investment valuation. Instead the best use for a DCF model is to test certain assumptions and theories to see if they would lead to the company being undervalued or overvalued. For instance, if the terminal value growth rate is adjusted slightly, it can dramatically alter the overall result. Can we work out why the company is trading at a discount to intrinsic value? For Adecoagro, we've put together three additional aspects you should explore:
- Risks: Take risks, for example - Adecoagro has 3 warning signs (and 1 which doesn't sit too well with us) we think you should know about.
- Future Earnings: How does AGRO's growth rate compare to its peers and the wider market? Dig deeper into the analyst consensus number for the upcoming years by interacting with our free analyst growth expectation chart.
- Other High Quality Alternatives: Do you like a good all-rounder? Explore our interactive list of high quality stocks to get an idea of what else is out there you may be missing!
PS. The Simply Wall St app conducts a discounted cash flow valuation for every stock on the NYSE every day. If you want to find the calculation for other stocks just search here.
New: Manage All Your Stock Portfolios in One Place
We've created the ultimate portfolio companion for stock investors, and it's free.
• Connect an unlimited number of Portfolios and see your total in one currency
• Be alerted to new Warning Signs or Risks via email or mobile
• Track the Fair Value of your stocks
Have feedback on this article? Concerned about the content? Get in touch with us directly. Alternatively, email editorial-team (at) simplywallst.com.
This article by Simply Wall St is general in nature. We provide commentary based on historical data and analyst forecasts only using an unbiased methodology and our articles are not intended to be financial advice. It does not constitute a recommendation to buy or sell any stock, and does not take account of your objectives, or your financial situation. We aim to bring you long-term focused analysis driven by fundamental data. Note that our analysis may not factor in the latest price-sensitive company announcements or qualitative material. Simply Wall St has no position in any stocks mentioned.
About NYSE:AGRO
Adecoagro
An agro-industrial company, engages in various businesses in Argentina, Brazil, and Uruguay.
Undervalued with adequate balance sheet.
Similar Companies
Market Insights

Advertisement
Community Narratives
RIO is poised to weather a depressed iron ore environment, but commodity diversification comes with lower margins
Fair Value AU$110.51|4.0% overvalued
DU
Community Contributor
The demand for personalized medicine will keep Thermo Fisher Scientific thriving
Fair Value US$540.27|21.0% undervalued
UN
Community Contributor
Silver Play by A Family with 10x Potential
Fair Value UK£24.00|88.8% undervalued
RO
Community Contributor