- United States
- /
- Beverage
- /
- NasdaqGS:KDP
Keurig Dr Pepper Inc.'s (NASDAQ:KDP) Intrinsic Value Is Potentially 70% Above Its Share Price

Key Insights
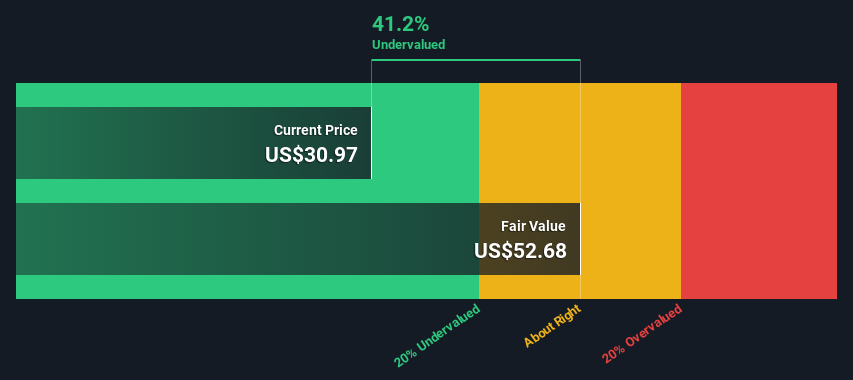
- Using the 2 Stage Free Cash Flow to Equity, Keurig Dr Pepper fair value estimate is US$52.68
- Current share price of US$30.97 suggests Keurig Dr Pepper is potentially 41% undervalued
- Our fair value estimate is 47% higher than Keurig Dr Pepper's analyst price target of US$35.88
Today we'll do a simple run through of a valuation method used to estimate the attractiveness of Keurig Dr Pepper Inc. (NASDAQ:KDP) as an investment opportunity by taking the forecast future cash flows of the company and discounting them back to today's value. We will take advantage of the Discounted Cash Flow (DCF) model for this purpose. Believe it or not, it's not too difficult to follow, as you'll see from our example!
We generally believe that a company's value is the present value of all of the cash it will generate in the future. However, a DCF is just one valuation metric among many, and it is not without flaws. If you want to learn more about discounted cash flow, the rationale behind this calculation can be read in detail in the Simply Wall St analysis model.
See our latest analysis for Keurig Dr Pepper
The Calculation
We're using the 2-stage growth model, which simply means we take in account two stages of company's growth. In the initial period the company may have a higher growth rate and the second stage is usually assumed to have a stable growth rate. In the first stage we need to estimate the cash flows to the business over the next ten years. Where possible we use analyst estimates, but when these aren't available we extrapolate the previous free cash flow (FCF) from the last estimate or reported value. We assume companies with shrinking free cash flow will slow their rate of shrinkage, and that companies with growing free cash flow will see their growth rate slow, over this period. We do this to reflect that growth tends to slow more in the early years than it does in later years.
A DCF is all about the idea that a dollar in the future is less valuable than a dollar today, and so the sum of these future cash flows is then discounted to today's value:
10-year free cash flow (FCF) estimate
| 2024 | 2025 | 2026 | 2027 | 2028 | 2029 | 2030 | 2031 | 2032 | 2033 | |
| Levered FCF ($, Millions) | US$2.50b | US$2.76b | US$3.04b | US$3.19b | US$3.20b | US$3.22b | US$3.26b | US$3.31b | US$3.37b | US$3.44b |
| Growth Rate Estimate Source | Analyst x5 | Analyst x4 | Analyst x1 | Analyst x1 | Analyst x1 | Est @ 0.81% | Est @ 1.25% | Est @ 1.56% | Est @ 1.78% | Est @ 1.93% |
| Present Value ($, Millions) Discounted @ 6.1% | US$2.4k | US$2.4k | US$2.5k | US$2.5k | US$2.4k | US$2.3k | US$2.2k | US$2.1k | US$2.0k | US$1.9k |
("Est" = FCF growth rate estimated by Simply Wall St)
Present Value of 10-year Cash Flow (PVCF) = US$23b
After calculating the present value of future cash flows in the initial 10-year period, we need to calculate the Terminal Value, which accounts for all future cash flows beyond the first stage. The Gordon Growth formula is used to calculate Terminal Value at a future annual growth rate equal to the 5-year average of the 10-year government bond yield of 2.3%. We discount the terminal cash flows to today's value at a cost of equity of 6.1%.
Terminal Value (TV)= FCF2033 × (1 + g) ÷ (r – g) = US$3.4b× (1 + 2.3%) ÷ (6.1%– 2.3%) = US$92b
Present Value of Terminal Value (PVTV)= TV / (1 + r)10= US$92b÷ ( 1 + 6.1%)10= US$51b
The total value is the sum of cash flows for the next ten years plus the discounted terminal value, which results in the Total Equity Value, which in this case is US$74b. The last step is to then divide the equity value by the number of shares outstanding. Compared to the current share price of US$31.0, the company appears quite good value at a 41% discount to where the stock price trades currently. The assumptions in any calculation have a big impact on the valuation, so it is better to view this as a rough estimate, not precise down to the last cent.
Important Assumptions
The calculation above is very dependent on two assumptions. The first is the discount rate and the other is the cash flows. You don't have to agree with these inputs, I recommend redoing the calculations yourself and playing with them. The DCF also does not consider the possible cyclicality of an industry, or a company's future capital requirements, so it does not give a full picture of a company's potential performance. Given that we are looking at Keurig Dr Pepper as potential shareholders, the cost of equity is used as the discount rate, rather than the cost of capital (or weighted average cost of capital, WACC) which accounts for debt. In this calculation we've used 6.1%, which is based on a levered beta of 0.828. Beta is a measure of a stock's volatility, compared to the market as a whole. We get our beta from the industry average beta of globally comparable companies, with an imposed limit between 0.8 and 2.0, which is a reasonable range for a stable business.
SWOT Analysis for Keurig Dr Pepper
- Debt is well covered by earnings.
- Dividends are covered by earnings and cash flows.
- Earnings growth over the past year underperformed the Beverage industry.
- Dividend is low compared to the top 25% of dividend payers in the Beverage market.
- Annual earnings are forecast to grow for the next 4 years.
- Trading below our estimate of fair value by more than 20%.
- Debt is not well covered by operating cash flow.
- Annual earnings are forecast to grow slower than the American market.
Moving On:
Whilst important, the DCF calculation shouldn't be the only metric you look at when researching a company. DCF models are not the be-all and end-all of investment valuation. Preferably you'd apply different cases and assumptions and see how they would impact the company's valuation. For example, changes in the company's cost of equity or the risk free rate can significantly impact the valuation. What is the reason for the share price sitting below the intrinsic value? For Keurig Dr Pepper, there are three additional items you should further research:
- Risks: For example, we've discovered 2 warning signs for Keurig Dr Pepper (1 is a bit concerning!) that you should be aware of before investing here.
- Future Earnings: How does KDP's growth rate compare to its peers and the wider market? Dig deeper into the analyst consensus number for the upcoming years by interacting with our free analyst growth expectation chart.
- Other High Quality Alternatives: Do you like a good all-rounder? Explore our interactive list of high quality stocks to get an idea of what else is out there you may be missing!
PS. The Simply Wall St app conducts a discounted cash flow valuation for every stock on the NASDAQGS every day. If you want to find the calculation for other stocks just search here.
Valuation is complex, but we're here to simplify it.
Discover if Keurig Dr Pepper might be undervalued or overvalued with our detailed analysis, featuring fair value estimates, potential risks, dividends, insider trades, and its financial condition.
Access Free AnalysisHave feedback on this article? Concerned about the content? Get in touch with us directly. Alternatively, email editorial-team (at) simplywallst.com.
This article by Simply Wall St is general in nature. We provide commentary based on historical data and analyst forecasts only using an unbiased methodology and our articles are not intended to be financial advice. It does not constitute a recommendation to buy or sell any stock, and does not take account of your objectives, or your financial situation. We aim to bring you long-term focused analysis driven by fundamental data. Note that our analysis may not factor in the latest price-sensitive company announcements or qualitative material. Simply Wall St has no position in any stocks mentioned.
About NasdaqGS:KDP
Keurig Dr Pepper
Owns, manufactures, and distributors beverages and single serve brewing systems in the United States and internationally.
Undervalued with solid track record.
