- United States
- /
- Oil and Gas
- /
- NYSE:TPL
Calculating The Fair Value Of Texas Pacific Land Corporation (NYSE:TPL)


Key Insights
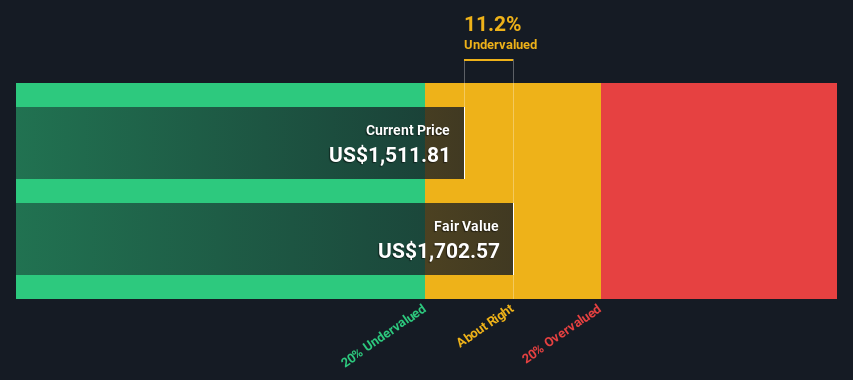
- Using the 2 Stage Free Cash Flow to Equity, Texas Pacific Land fair value estimate is US$1,703
- Current share price of US$1,512 suggests Texas Pacific Land is potentially trading close to its fair value
- Our fair value estimate is 13% lower than Texas Pacific Land's analyst price target of US$1,953
Today we will run through one way of estimating the intrinsic value of Texas Pacific Land Corporation (NYSE:TPL) by projecting its future cash flows and then discounting them to today's value. Our analysis will employ the Discounted Cash Flow (DCF) model. It may sound complicated, but actually it is quite simple!
Remember though, that there are many ways to estimate a company's value, and a DCF is just one method. For those who are keen learners of equity analysis, the Simply Wall St analysis model here may be something of interest to you.
Check out our latest analysis for Texas Pacific Land
Is Texas Pacific Land Fairly Valued?
We're using the 2-stage growth model, which simply means we take in account two stages of company's growth. In the initial period the company may have a higher growth rate and the second stage is usually assumed to have a stable growth rate. To begin with, we have to get estimates of the next ten years of cash flows. Where possible we use analyst estimates, but when these aren't available we extrapolate the previous free cash flow (FCF) from the last estimate or reported value. We assume companies with shrinking free cash flow will slow their rate of shrinkage, and that companies with growing free cash flow will see their growth rate slow, over this period. We do this to reflect that growth tends to slow more in the early years than it does in later years.
A DCF is all about the idea that a dollar in the future is less valuable than a dollar today, and so the sum of these future cash flows is then discounted to today's value:
10-year free cash flow (FCF) estimate
| 2024 | 2025 | 2026 | 2027 | 2028 | 2029 | 2030 | 2031 | 2032 | 2033 | |
| Levered FCF ($, Millions) | US$465.5m | US$556.5m | US$611.7m | US$658.4m | US$698.0m | US$732.3m | US$762.5m | US$789.7m | US$814.9m | US$838.7m |
| Growth Rate Estimate Source | Analyst x2 | Analyst x2 | Est @ 9.92% | Est @ 7.63% | Est @ 6.03% | Est @ 4.91% | Est @ 4.12% | Est @ 3.57% | Est @ 3.19% | Est @ 2.92% |
| Present Value ($, Millions) Discounted @ 7.3% | US$434 | US$483 | US$495 | US$496 | US$490 | US$479 | US$465 | US$449 | US$432 | US$414 |
("Est" = FCF growth rate estimated by Simply Wall St)
Present Value of 10-year Cash Flow (PVCF) = US$4.6b
After calculating the present value of future cash flows in the initial 10-year period, we need to calculate the Terminal Value, which accounts for all future cash flows beyond the first stage. The Gordon Growth formula is used to calculate Terminal Value at a future annual growth rate equal to the 5-year average of the 10-year government bond yield of 2.3%. We discount the terminal cash flows to today's value at a cost of equity of 7.3%.
Terminal Value (TV)= FCF2033 × (1 + g) ÷ (r – g) = US$839m× (1 + 2.3%) ÷ (7.3%– 2.3%) = US$17b
Present Value of Terminal Value (PVTV)= TV / (1 + r)10= US$17b÷ ( 1 + 7.3%)10= US$8.4b
The total value, or equity value, is then the sum of the present value of the future cash flows, which in this case is US$13b. To get the intrinsic value per share, we divide this by the total number of shares outstanding. Compared to the current share price of US$1.5k, the company appears about fair value at a 11% discount to where the stock price trades currently. Remember though, that this is just an approximate valuation, and like any complex formula - garbage in, garbage out.
The Assumptions
Now the most important inputs to a discounted cash flow are the discount rate, and of course, the actual cash flows. If you don't agree with these result, have a go at the calculation yourself and play with the assumptions. The DCF also does not consider the possible cyclicality of an industry, or a company's future capital requirements, so it does not give a full picture of a company's potential performance. Given that we are looking at Texas Pacific Land as potential shareholders, the cost of equity is used as the discount rate, rather than the cost of capital (or weighted average cost of capital, WACC) which accounts for debt. In this calculation we've used 7.3%, which is based on a levered beta of 1.092. Beta is a measure of a stock's volatility, compared to the market as a whole. We get our beta from the industry average beta of globally comparable companies, with an imposed limit between 0.8 and 2.0, which is a reasonable range for a stable business.
SWOT Analysis for Texas Pacific Land
- Currently debt free.
- Dividends are covered by earnings and cash flows.
- Earnings declined over the past year.
- Dividend is low compared to the top 25% of dividend payers in the Oil and Gas market.
- Annual revenue is forecast to grow faster than the American market.
- Current share price is below our estimate of fair value.
- Annual earnings are forecast to grow slower than the American market.
Next Steps:
Whilst important, the DCF calculation ideally won't be the sole piece of analysis you scrutinize for a company. The DCF model is not a perfect stock valuation tool. Instead the best use for a DCF model is to test certain assumptions and theories to see if they would lead to the company being undervalued or overvalued. For example, changes in the company's cost of equity or the risk free rate can significantly impact the valuation. For Texas Pacific Land, we've put together three further factors you should further examine:
- Financial Health: Does TPL have a healthy balance sheet? Take a look at our free balance sheet analysis with six simple checks on key factors like leverage and risk.
- Management:Have insiders been ramping up their shares to take advantage of the market's sentiment for TPL's future outlook? Check out our management and board analysis with insights on CEO compensation and governance factors.
- Other Solid Businesses: Low debt, high returns on equity and good past performance are fundamental to a strong business. Why not explore our interactive list of stocks with solid business fundamentals to see if there are other companies you may not have considered!
PS. The Simply Wall St app conducts a discounted cash flow valuation for every stock on the NYSE every day. If you want to find the calculation for other stocks just search here.
If you're looking to trade Texas Pacific Land, open an account with the lowest-cost platform trusted by professionals, Interactive Brokers.
With clients in over 200 countries and territories, and access to 160 markets, IBKR lets you trade stocks, options, futures, forex, bonds and funds from a single integrated account.
Enjoy no hidden fees, no account minimums, and FX conversion rates as low as 0.03%, far better than what most brokers offer.
Sponsored ContentValuation is complex, but we're here to simplify it.
Discover if Texas Pacific Land might be undervalued or overvalued with our detailed analysis, featuring fair value estimates, potential risks, dividends, insider trades, and its financial condition.
Access Free AnalysisHave feedback on this article? Concerned about the content? Get in touch with us directly. Alternatively, email editorial-team (at) simplywallst.com.
This article by Simply Wall St is general in nature. We provide commentary based on historical data and analyst forecasts only using an unbiased methodology and our articles are not intended to be financial advice. It does not constitute a recommendation to buy or sell any stock, and does not take account of your objectives, or your financial situation. We aim to bring you long-term focused analysis driven by fundamental data. Note that our analysis may not factor in the latest price-sensitive company announcements or qualitative material. Simply Wall St has no position in any stocks mentioned.
About NYSE:TPL
Texas Pacific Land
Engages in the land and resource management, and water services and operations businesses.
Flawless balance sheet with proven track record.

