Advertisement
- United States
- /
- Energy Services
- /
- NYSE:SLB
Is SLB a Bargain After Recent 15% Year to Date Drop?

Simply Wall St
Reviewed by Bailey Pemberton
If you are trying to figure out what to do with SLB stock right now, you are not alone. Investors have watched SLB slide by 5.3% in the past week, tack on an 8.4% loss over the last month, and fall more than 15% year to date. Even longer-term holders have felt some pain lately, with shares down 21.9% over the past year. But despite recent market volatility, the stock has soared 133.6% in the past five years, showing there is a lot more to SLB than meets the eye.
Part of what is driving these roller-coaster moves has been the shifting sentiment around the oilfield services sector. Discussions about energy transition, evolving geopolitical risks, and tightening industry supply have kept traders on their toes. Some of the choppiness in SLB’s stock mirrors these bigger trends rather than just company-specific issues.
Now, here is where things get interesting. When I stacked SLB against six of the main valuation measures, it came out undervalued in five of them, landing a value score of 5. For anyone looking for a potentially overlooked gem, that is a number worth noting. But what does that really mean for the stock’s future direction?
Let’s dig into each of the major valuation approaches to see where SLB stands. And stick around to the end, as you will want to see the one valuation lens I think matters most in today’s market.
Why SLB is lagging behind its peers
Approach 1: SLB Discounted Cash Flow (DCF) Analysis
The Discounted Cash Flow (DCF) model is a fundamental valuation approach that estimates a company’s intrinsic value by projecting its future free cash flows and discounting them back to today’s dollars. In essence, this method focuses on forecasting the cash SLB will generate and determining the present value of that stream.
For SLB, the most recently reported Free Cash Flow is $4.01 billion. Analysts forecast continued steady growth, with Free Cash Flow expected to reach $5.60 billion by the end of 2029. While direct analyst estimates only extend about five years into the future, projections for subsequent years are extrapolated using Simply Wall St’s methodology, maintaining consistent momentum through 2035.
Based on these cash flow projections and the 2 Stage Free Cash Flow to Equity model, SLB’s estimated intrinsic value is $69.71 per share. This figure represents a 53.3% discount compared to the company’s current trading price, which may suggest the stock is undervalued at present.
Result: UNDERVALUED
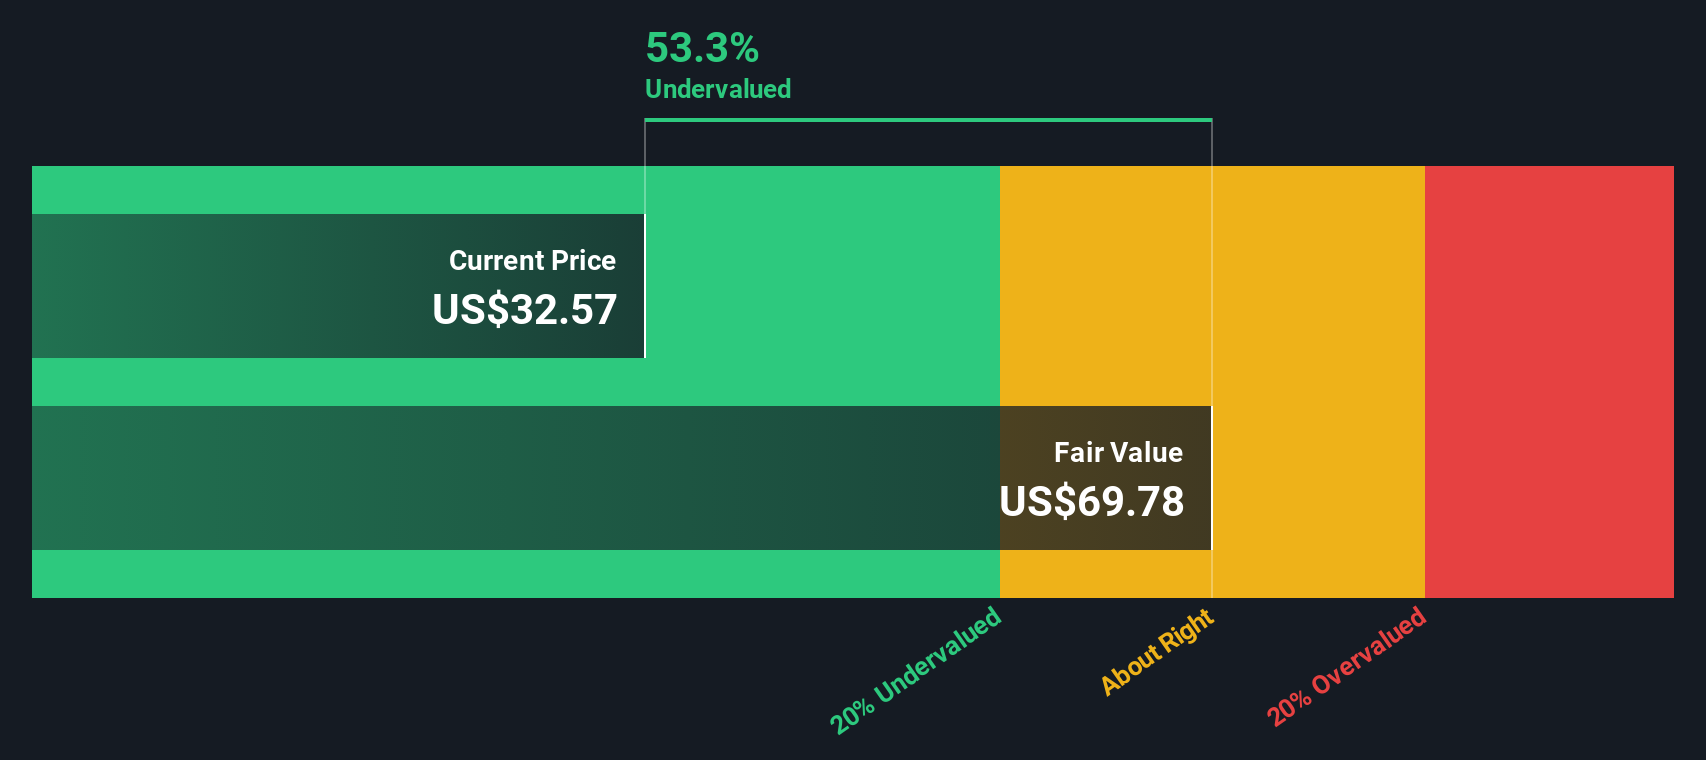
Our Discounted Cash Flow (DCF) analysis suggests SLB is undervalued by 53.3%. Track this in your watchlist or portfolio, or discover more undervalued stocks.
Approach 2: SLB Price vs Earnings
The Price-to-Earnings (PE) ratio is one of the most popular yardsticks for valuing profitable companies because it directly connects a company’s market price to the earnings it generates. For businesses like SLB that consistently produce earnings, the PE ratio can give investors a useful sense of whether they are paying a reasonable amount for each dollar of profit.
What counts as a “normal” PE ratio is always relative. Companies with higher growth expectations or lower perceived risks often trade at higher PE ratios, while those facing slower growth or more uncertainty command lower ratios. This is why comparing a company’s PE to its sector, peers, and the broader market is common practice.
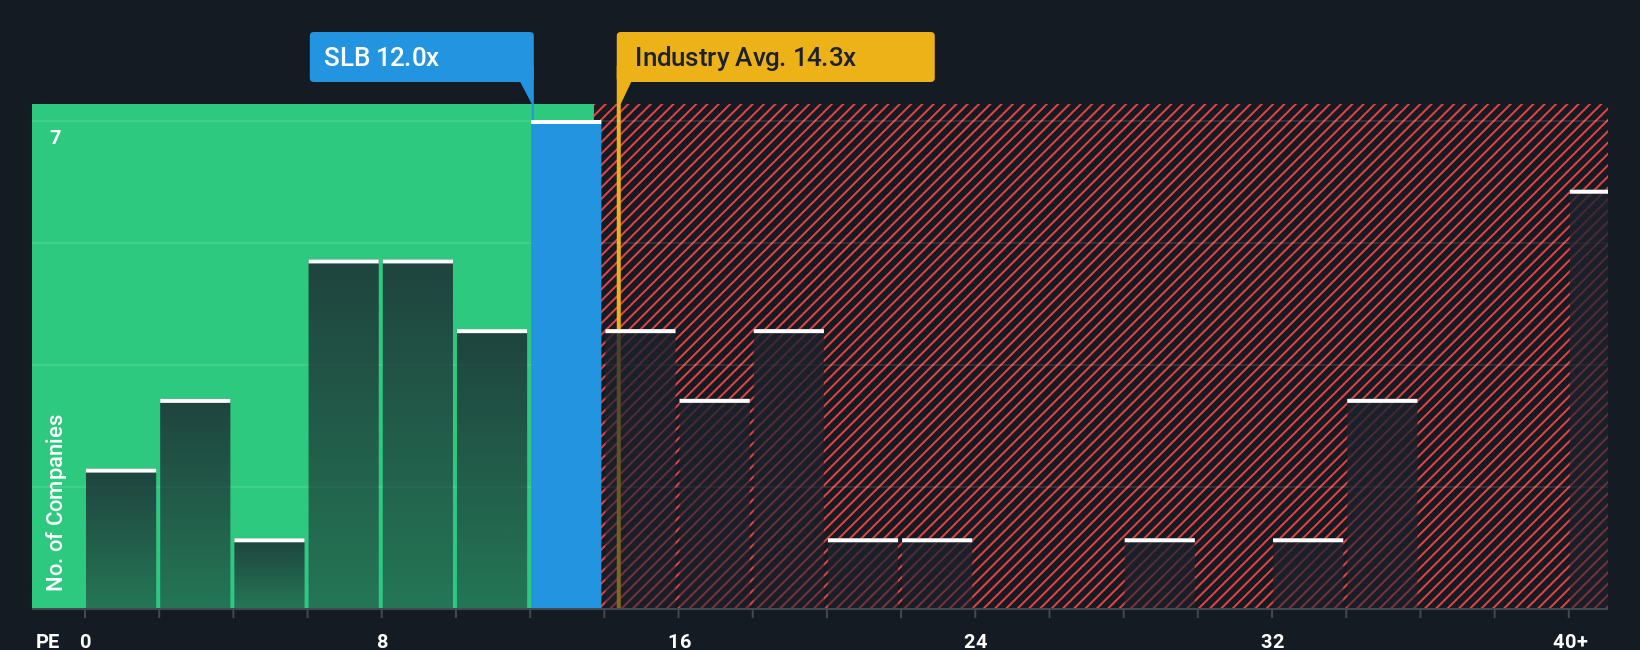
SLB currently trades at a PE ratio of 11.89x. That is notably lower than the Energy Services industry average of 14.16x and just below the peer group average of 12.50x. At first glance, this could make SLB look inexpensive compared to its market context.
To get a fuller picture, it helps to look at Simply Wall St’s proprietary “Fair Ratio.” This measure calculates the PE expected for SLB, given its unique blend of growth rate, profit margin, market cap, industry, and specific risk profile. By taking these factors into account, the Fair Ratio (18.19x) provides a more tailored benchmark than broad industry numbers.
Because SLB’s current PE ratio of 11.89x is well below its Fair Ratio of 18.19x, this suggests the stock is undervalued based on its earnings profile and company fundamentals.
Result: UNDERVALUED
PE ratios tell one story, but what if the real opportunity lies elsewhere? Discover companies where insiders are betting big on explosive growth.
Upgrade Your Decision Making: Choose your SLB Narrative
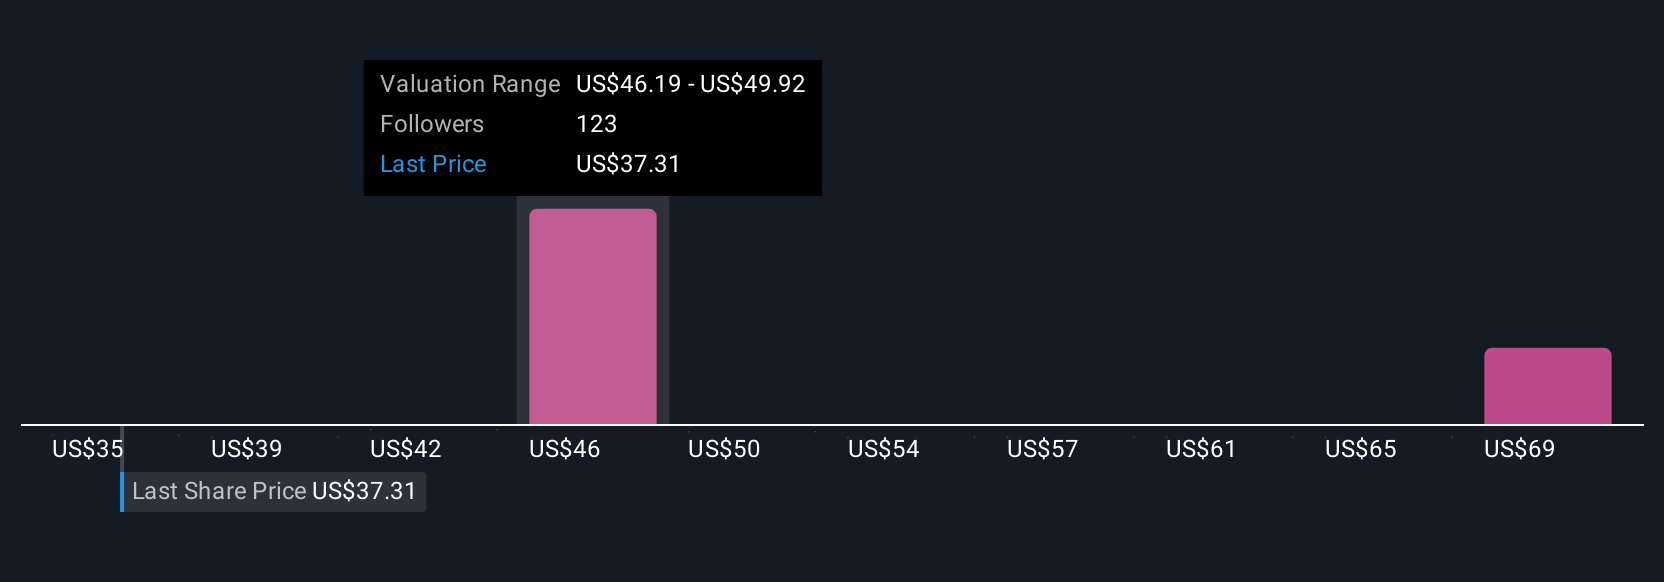
Earlier we mentioned that there is an even better way to understand valuation, so let’s introduce you to Narratives. A Narrative is a simple, approachable way to express your view on a company like SLB by connecting its story, including your reasons and expectations about future revenue, earnings, and profit margins, with a financial forecast, which then leads directly to a fair value estimate.
Narratives let you look beyond just the numbers, making it easy to see the bigger picture and share your perspective with the Simply Wall St Community, where millions of investors use this tool right on each company’s Community page. With Narratives, you can decide when to buy or sell by comparing your own Fair Value (based on your forecast and story) to the current market Price.
Narratives automatically update when new information like company news or earnings arrives, so your investment thesis and value always stay relevant. For example, some SLB investors believe surging global energy demand and digital expansion will boost revenue and margins, supporting bullish high price targets, while others cite ongoing macro headwinds and energy transition risks to justify more conservative or bearish outlooks. Narratives make all of those perspectives transparent and actionable in one place.
Do you think there's more to the story for SLB? Create your own Narrative to let the Community know!
This article by Simply Wall St is general in nature. We provide commentary based on historical data and analyst forecasts only using an unbiased methodology and our articles are not intended to be financial advice. It does not constitute a recommendation to buy or sell any stock, and does not take account of your objectives, or your financial situation. We aim to bring you long-term focused analysis driven by fundamental data. Note that our analysis may not factor in the latest price-sensitive company announcements or qualitative material. Simply Wall St has no position in any stocks mentioned.
New: Manage All Your Stock Portfolios in One Place
We've created the ultimate portfolio companion for stock investors, and it's free.
• Connect an unlimited number of Portfolios and see your total in one currency
• Be alerted to new Warning Signs or Risks via email or mobile
• Track the Fair Value of your stocks
Have feedback on this article? Concerned about the content? Get in touch with us directly. Alternatively, email editorial-team@simplywallst.com
About NYSE:SLB
SLB
Engages in the provision of technology for the energy industry worldwide.
Undervalued with excellent balance sheet.
Similar Companies
Market Insights

Advertisement
Community Narratives
A formidable player in AI and enterprise computing.
Fair Value US$210.00|3.9% overvalued
CO
Community Contributor
IREN's Bold Moves in Sustainable Bitcoin Mining & AI Data Centers
Fair Value US$89.00|21.8% undervalued
BL
Community Contributor
Cooling the Champions: The Aussie Tech Behind F1's Victories
Fair Value AU$12.40|40.6% undervalued
TR
Community Contributor