Advertisement
- United States
- /
- Energy Services
- /
- NYSE:FTI
Is There Still Opportunity in TechnipFMC After Its 8% Drop in June 2025?

Simply Wall St
Reviewed by Bailey Pemberton
Trying to figure out your next move with TechnipFMC? You are not the only one watching this stock closely right now. Whether you are holding shares or eyeing a new entry point, there is plenty to unpack, especially after such a wild ride in recent years. The company’s share price closed at $35.57, and while there was a dip of 6.2% over the last week and 8.8% for the month, the longer-term picture tells a different story. Year-to-date, TechnipFMC is up 20.3%. Stretch back a year and you are looking at gains of 35.2%. Zoom out to three or five years, and those returns soar to 264.5% and an astonishing 599.1% respectively. It is clear that investors have been re-rating the company’s growth prospects and risk profile, especially as the market considers global shifts in energy and offshore production.
With price movements like these, the big question is whether TechnipFMC still offers value, or if the ship has sailed. The company currently earns a 4 out of 6 on our value score. That means it comes up as undervalued on four key valuation checks, but not all of them. In other words, there could still be an opportunity here, even after such standout gains.
Let us dig into the main valuation approaches analysts use to size up a stock like TechnipFMC. And stick around—at the end of the article, I will show you a better way to judge whether the value score really gives you the full story.
Approach 1: TechnipFMC Discounted Cash Flow (DCF) Analysis
The Discounted Cash Flow (DCF) model estimates a company’s value by projecting its future cash flows and discounting them back to today using a rate that reflects risk and opportunity cost. For TechnipFMC, this approach considers both analyst forecasts and longer-term projections to gauge its intrinsic worth.
Right now, TechnipFMC generates Free Cash Flow (FCF) of about $1.43 billion, and analysts expect this to fluctuate in the $1.15 to $1.24 billion range over the next several years. By 2029, projections show FCF at approximately $1.19 billion. Estimates beyond that are extrapolated, but the overall trajectory is for FCF to remain robust, which is an important signal for long-term investors.
Based on these forecasts, the DCF model estimates TechnipFMC’s intrinsic value at $50.13 per share. With the recent market price at $35.57, the DCF points to a 29% discount. In other words, the shares are trading well below their estimated fair value, making them look attractively undervalued by this measure.
Result: UNDERVALUED
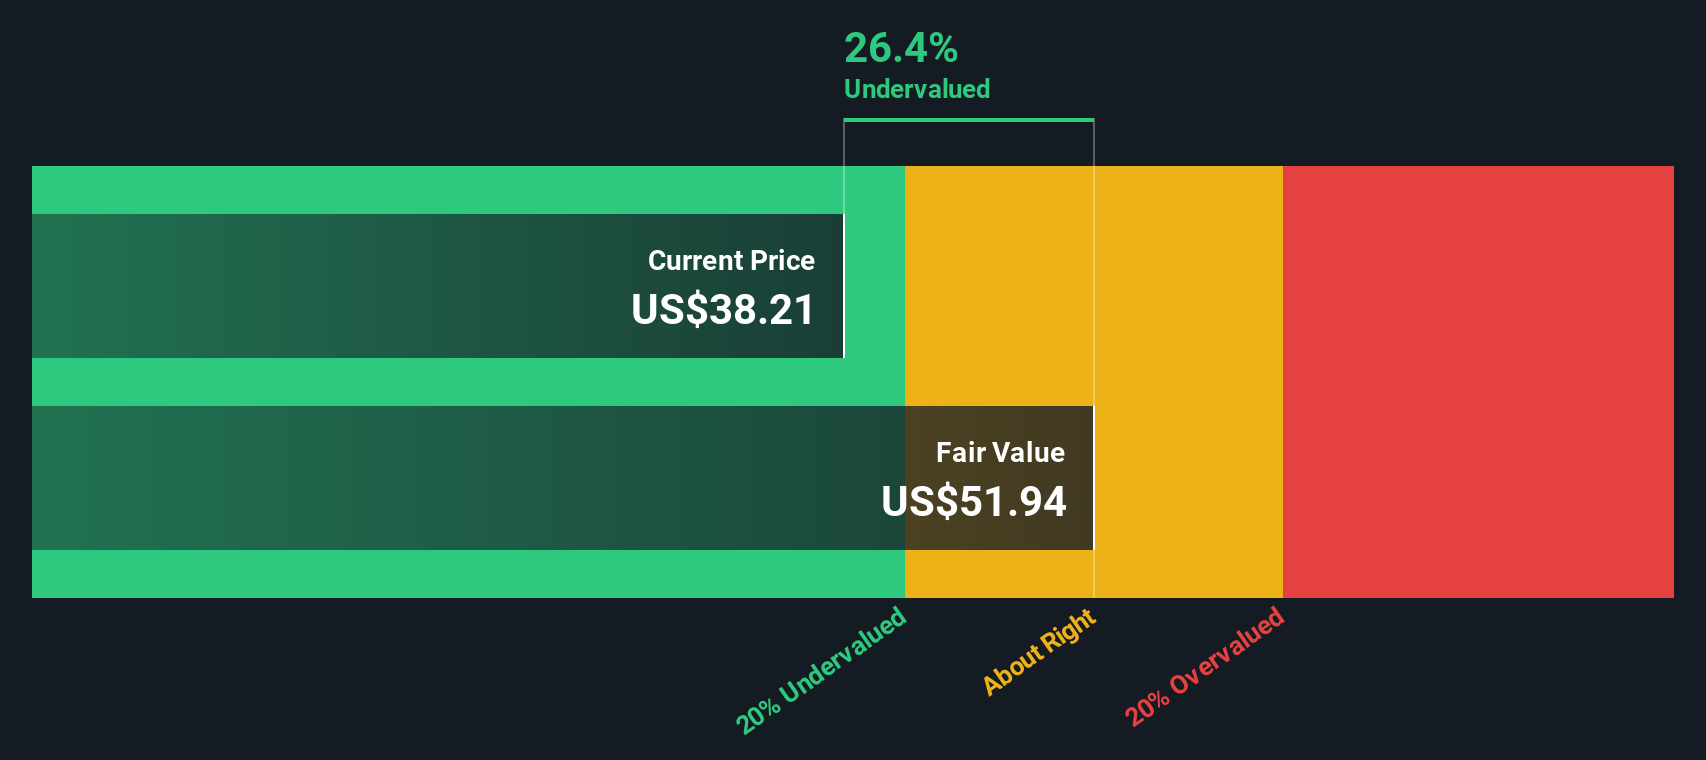
Our Discounted Cash Flow (DCF) analysis suggests TechnipFMC is undervalued by 29.0%. Track this in your watchlist or portfolio, or discover more undervalued stocks.
Approach 2: TechnipFMC Price vs Earnings
For companies that are profitable and have established earnings, the Price-to-Earnings (PE) ratio is one of the most reliable valuation tools. It helps investors gauge how much the market is willing to pay for each dollar of a company’s earnings, factoring in expectations of future growth and any risks on the horizon. In general, faster-growing companies or those with lower risk profiles tend to command higher PE ratios, while slower growth or higher risk pushes the “fair” multiple lower.
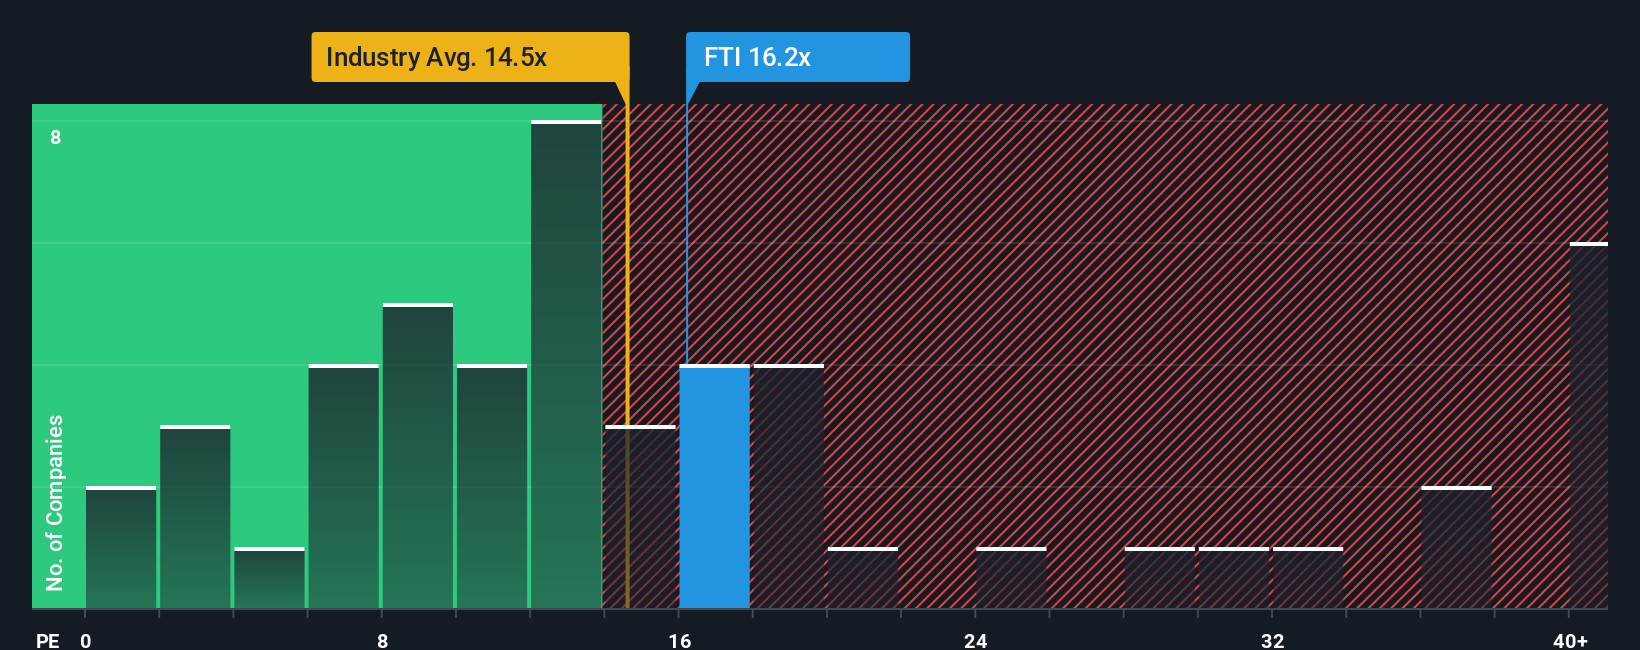
TechnipFMC is currently trading at a PE ratio of 15.6x. That sits a bit above the average PE of 14.3x for the Energy Services industry and notably higher than its peer average of 11.5x. At first glance, this suggests a premium compared to both its sector and close competitors. This may potentially reflect the market’s expectations for the company’s growth or relative strength.
However, Simply Wall St’s Fair Ratio model takes things further than standard industry or peer comparisons. Instead of looking only at averages, it calculates a bespoke “Fair PE Ratio” of 16.7x for TechnipFMC. This considers the company’s specific earnings growth, margins, size, industry trends, and particular risk factors. This comprehensive approach provides a smarter benchmark for fair value than relying on basic comparisons without context.
Comparing the Fair Ratio of 16.7x to TechnipFMC’s actual PE of 15.6x shows the stock is priced almost exactly in line with its fundamental position. This suggests the current valuation is balanced given its outlook and risks.
Result: ABOUT RIGHT
PE ratios tell one story, but what if the real opportunity lies elsewhere? Discover companies where insiders are betting big on explosive growth.
Upgrade Your Decision Making: Choose your TechnipFMC Narrative
Earlier we mentioned there is an even better way to understand valuation, so let us introduce you to Narratives, a simpler, smarter way for investors to connect a company’s numbers with their own story about its future.
A Narrative links your view of TechnipFMC’s business outlook, such as assumptions about future revenues, earnings, margins, and risks, to a calculated Fair Value in one cohesive snapshot. This makes it much easier to see if the price makes sense for your investing style.
Available on Simply Wall St’s Community page and used by millions of investors, Narratives make it easy for anyone, not just market experts, to combine their research and intuition with real numbers. This allows users to create forecasts that are instantly compared to the company’s current price.
When news, earnings, or new data emerge, Narratives update automatically, giving you a living reflection of how the story and fair value have changed. This way, you are never investing with out-of-date information.
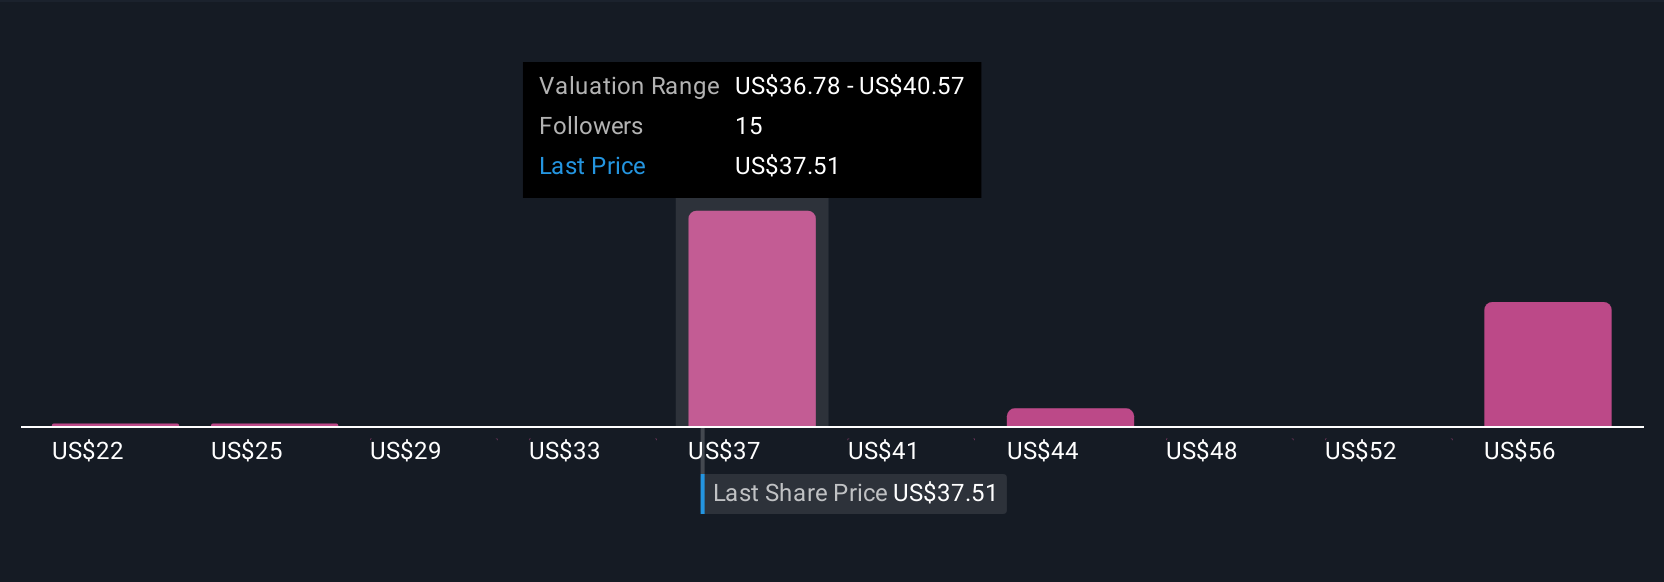
For example, some investors are most bullish on TechnipFMC with a fair value estimate of $51.00 based on expectations for robust Subsea order growth and expanding margins. Bears, on the other hand, see value as low as $30.00, reflecting greater caution around global energy transition risks. Narratives make it easy to compare these perspectives side by side and understand the reasoning behind each estimate.
Do you think there's more to the story for TechnipFMC? Create your own Narrative to let the Community know!
This article by Simply Wall St is general in nature. We provide commentary based on historical data and analyst forecasts only using an unbiased methodology and our articles are not intended to be financial advice. It does not constitute a recommendation to buy or sell any stock, and does not take account of your objectives, or your financial situation. We aim to bring you long-term focused analysis driven by fundamental data. Note that our analysis may not factor in the latest price-sensitive company announcements or qualitative material. Simply Wall St has no position in any stocks mentioned.
Valuation is complex, but we're here to simplify it.
Discover if TechnipFMC might be undervalued or overvalued with our detailed analysis, featuring fair value estimates, potential risks, dividends, insider trades, and its financial condition.
Access Free AnalysisHave feedback on this article? Concerned about the content? Get in touch with us directly. Alternatively, email editorial-team@simplywallst.com
About NYSE:FTI
TechnipFMC
Engages in the energy projects, technologies, systems, and services businesses in Europe, Central Asia, North America, Latin America, the Asia Pacific, Africa, the Middle East, and internationally.
Outstanding track record with flawless balance sheet.
Similar Companies
Market Insights

Advertisement
Community Narratives
A formidable player in AI and enterprise computing.
Fair Value US$210.00|13.6% overvalued
CO
Community Contributor
IREN's Bold Moves in Sustainable Bitcoin Mining & AI Data Centers
Fair Value US$89.00|23.6% undervalued
BL
Community Contributor
Cooling the Champions: The Aussie Tech Behind F1's Victories
Fair Value AU$12.40|37.6% undervalued
TR
Community Contributor