- United States
- /
- Energy Services
- /
- NasdaqGS:WFRD
Revenues Not Telling The Story For Weatherford International plc (NASDAQ:WFRD) After Shares Rise 28%

Weatherford International plc (NASDAQ:WFRD) shares have had a really impressive month, gaining 28% after a shaky period beforehand. Looking back a bit further, it's encouraging to see the stock is up 58% in the last year.
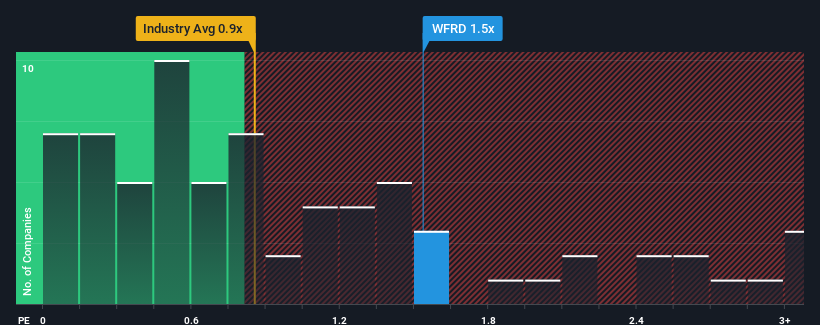
Following the firm bounce in price, given close to half the companies operating in the United States' Energy Services industry have price-to-sales ratios (or "P/S") below 0.9x, you may consider Weatherford International as a stock to potentially avoid with its 1.5x P/S ratio. Although, it's not wise to just take the P/S at face value as there may be an explanation why it's as high as it is.
See our latest analysis for Weatherford International

What Does Weatherford International's P/S Mean For Shareholders?
With revenue growth that's inferior to most other companies of late, Weatherford International has been relatively sluggish. Perhaps the market is expecting future revenue performance to undergo a reversal of fortunes, which has elevated the P/S ratio. You'd really hope so, otherwise you're paying a pretty hefty price for no particular reason.
Keen to find out how analysts think Weatherford International's future stacks up against the industry? In that case, our free report is a great place to start.Do Revenue Forecasts Match The High P/S Ratio?
The only time you'd be truly comfortable seeing a P/S as high as Weatherford International's is when the company's growth is on track to outshine the industry.
Taking a look back first, we see that the company grew revenue by an impressive 19% last year. The latest three year period has also seen an excellent 39% overall rise in revenue, aided by its short-term performance. So we can start by confirming that the company has done a great job of growing revenue over that time.
Looking ahead now, revenue is anticipated to climb by 7.1% per annum during the coming three years according to the eight analysts following the company. With the industry predicted to deliver 8.6% growth each year, the company is positioned for a comparable revenue result.
With this information, we find it interesting that Weatherford International is trading at a high P/S compared to the industry. It seems most investors are ignoring the fairly average growth expectations and are willing to pay up for exposure to the stock. Although, additional gains will be difficult to achieve as this level of revenue growth is likely to weigh down the share price eventually.
The Key Takeaway
Weatherford International shares have taken a big step in a northerly direction, but its P/S is elevated as a result. While the price-to-sales ratio shouldn't be the defining factor in whether you buy a stock or not, it's quite a capable barometer of revenue expectations.
Analysts are forecasting Weatherford International's revenues to only grow on par with the rest of the industry, which has lead to the high P/S ratio being unexpected. Right now we are uncomfortable with the relatively high share price as the predicted future revenues aren't likely to support such positive sentiment for long. A positive change is needed in order to justify the current price-to-sales ratio.
Don't forget that there may be other risks. For instance, we've identified 3 warning signs for Weatherford International that you should be aware of.
Of course, profitable companies with a history of great earnings growth are generally safer bets. So you may wish to see this free collection of other companies that have reasonable P/E ratios and have grown earnings strongly.
If you're looking to trade Weatherford International, open an account with the lowest-cost platform trusted by professionals, Interactive Brokers.
With clients in over 200 countries and territories, and access to 160 markets, IBKR lets you trade stocks, options, futures, forex, bonds and funds from a single integrated account.
Enjoy no hidden fees, no account minimums, and FX conversion rates as low as 0.03%, far better than what most brokers offer.
Sponsored ContentValuation is complex, but we're here to simplify it.
Discover if Weatherford International might be undervalued or overvalued with our detailed analysis, featuring fair value estimates, potential risks, dividends, insider trades, and its financial condition.
Access Free AnalysisHave feedback on this article? Concerned about the content? Get in touch with us directly. Alternatively, email editorial-team (at) simplywallst.com.
This article by Simply Wall St is general in nature. We provide commentary based on historical data and analyst forecasts only using an unbiased methodology and our articles are not intended to be financial advice. It does not constitute a recommendation to buy or sell any stock, and does not take account of your objectives, or your financial situation. We aim to bring you long-term focused analysis driven by fundamental data. Note that our analysis may not factor in the latest price-sensitive company announcements or qualitative material. Simply Wall St has no position in any stocks mentioned.
About NasdaqGS:WFRD
Weatherford International
An energy services company, provides equipment and services for the drilling, evaluation, completion, production, and intervention of oil, geothermal, and natural gas wells worldwide.
Very undervalued with proven track record.
Similar Companies
Market Insights
Community Narratives


