
Advertisement
- United States
- /
- Energy Services
- /
- NasdaqGS:TUSK
Mammoth Energy Services (NASDAQ:TUSK) Is Making Moderate Use Of Debt
Howard Marks put it nicely when he said that, rather than worrying about share price volatility, 'The possibility of permanent loss is the risk I worry about... and every practical investor I know worries about.' It's only natural to consider a company's balance sheet when you examine how risky it is, since debt is often involved when a business collapses. We can see that Mammoth Energy Services, Inc. (NASDAQ:TUSK) does use debt in its business. But is this debt a concern to shareholders?
Why Does Debt Bring Risk?
Debt and other liabilities become risky for a business when it cannot easily fulfill those obligations, either with free cash flow or by raising capital at an attractive price. If things get really bad, the lenders can take control of the business. However, a more usual (but still expensive) situation is where a company must dilute shareholders at a cheap share price simply to get debt under control. Of course, the upside of debt is that it often represents cheap capital, especially when it replaces dilution in a company with the ability to reinvest at high rates of return. When we think about a company's use of debt, we first look at cash and debt together.
View our latest analysis for Mammoth Energy Services
How Much Debt Does Mammoth Energy Services Carry?
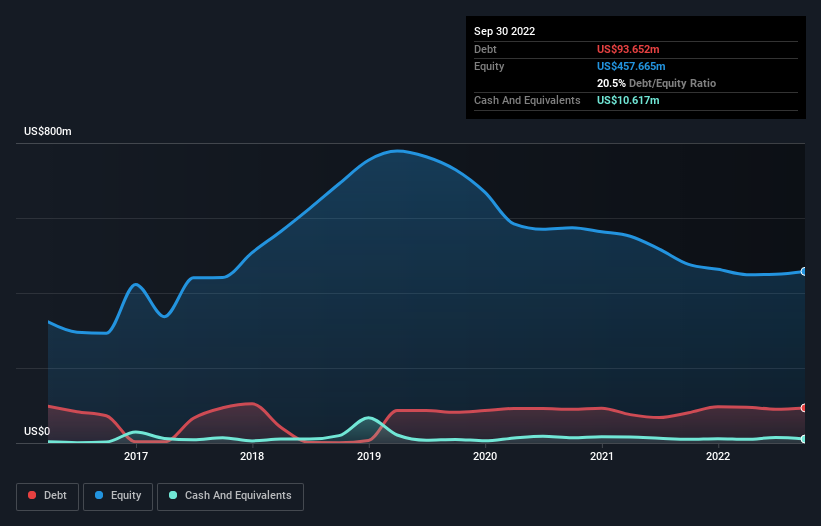
You can click the graphic below for the historical numbers, but it shows that as of September 2022 Mammoth Energy Services had US$93.7m of debt, an increase on US$80.7m, over one year. On the flip side, it has US$10.6m in cash leading to net debt of about US$83.0m.
How Strong Is Mammoth Energy Services' Balance Sheet?
According to the last reported balance sheet, Mammoth Energy Services had liabilities of US$142.5m due within 12 months, and liabilities of US$113.2m due beyond 12 months. Offsetting these obligations, it had cash of US$10.6m as well as receivables valued at US$463.4m due within 12 months. So it actually has US$218.3m more liquid assets than total liabilities.
This excess liquidity is a great indication that Mammoth Energy Services' balance sheet is almost as strong as Fort Knox. Having regard to this fact, we think its balance sheet is as strong as an ox. There's no doubt that we learn most about debt from the balance sheet. But it is Mammoth Energy Services's earnings that will influence how the balance sheet holds up in the future. So when considering debt, it's definitely worth looking at the earnings trend. Click here for an interactive snapshot.
In the last year Mammoth Energy Services wasn't profitable at an EBIT level, but managed to grow its revenue by 23%, to US$316m. With any luck the company will be able to grow its way to profitability.
Caveat Emptor
While we can certainly appreciate Mammoth Energy Services's revenue growth, its earnings before interest and tax (EBIT) loss is not ideal. Its EBIT loss was a whopping US$35m. That said, we're impressed with the strong balance sheet liquidity. That will give the company some time and space to grow and develop its business as need be. While the stock is probably a bit risky, there may be an opportunity if the business itself improves, allowing the company to stage a recovery. There's no doubt that we learn most about debt from the balance sheet. However, not all investment risk resides within the balance sheet - far from it. For example, we've discovered 4 warning signs for Mammoth Energy Services (2 are a bit unpleasant!) that you should be aware of before investing here.
If you're interested in investing in businesses that can grow profits without the burden of debt, then check out this free list of growing businesses that have net cash on the balance sheet.
New: Manage All Your Stock Portfolios in One Place
We've created the ultimate portfolio companion for stock investors, and it's free.
• Connect an unlimited number of Portfolios and see your total in one currency
• Be alerted to new Warning Signs or Risks via email or mobile
• Track the Fair Value of your stocks
Have feedback on this article? Concerned about the content? Get in touch with us directly. Alternatively, email editorial-team (at) simplywallst.com.
This article by Simply Wall St is general in nature. We provide commentary based on historical data and analyst forecasts only using an unbiased methodology and our articles are not intended to be financial advice. It does not constitute a recommendation to buy or sell any stock, and does not take account of your objectives, or your financial situation. We aim to bring you long-term focused analysis driven by fundamental data. Note that our analysis may not factor in the latest price-sensitive company announcements or qualitative material. Simply Wall St has no position in any stocks mentioned.
About NasdaqGS:TUSK
Mammoth Energy Services
Operates as an energy services company in the United States, Canada, and internationally.
Flawless balance sheet and good value.
Similar Companies
Market Insights

Advertisement
Community Narratives
A formidable player in AI and enterprise computing.
Fair Value US$210.00|12.2% overvalued
CO
Community Contributor
IREN's Bold Moves in Sustainable Bitcoin Mining & AI Data Centers
Fair Value US$72.52|17.1% undervalued
BL
Community Contributor
Cooling the Champions: The Aussie Tech Behind F1's Victories
Fair Value AU$12.40|38.7% undervalued
TR
Community Contributor