Advertisement
- United States
- /
- Oil and Gas
- /
- NasdaqGS:CHRD
Is Chord Energy Offering a Bargain After Recent 8.6% Weekly Drop?

Simply Wall St
Reviewed by Bailey Pemberton
If you own shares of Chord Energy or are just considering jumping in, you probably have one big question on your mind right now: is Chord Energy stock undervalued, or simply reflecting the new normal? The stock has had a rough run lately, down 8.6% in the past week and nearly 25% lower than this time last year. Risk perception has clearly shifted, likely due to broader energy sector volatility and shifting investor attitudes about growth versus value. Even with prices sliding, the company has not faced major negative headlines, so much of the recent move seems driven by overall market sentiment rather than company-specific drama.
But while some investors see red, others are looking for bargains. Here is the interesting part: Chord Energy just scored a 5 out of 6 on our value score, which means it is currently undervalued in nearly all the key ways analysts track. If you are weighing your next move with this stock, digging into those valuation checks can reveal a lot more than price charts alone. As we break down the different approaches the market uses to judge value, keep in mind that there might be an even better way to understand whether Chord Energy offers true opportunity. More on that at the end of the article.
Why Chord Energy is lagging behind its peers
Approach 1: Chord Energy Discounted Cash Flow (DCF) Analysis
A Discounted Cash Flow (DCF) model estimates a company's value by projecting its future cash flows and then discounting them back to today's dollars. This method aims to capture the true, long-term earnings power of a business by considering both current results and expected growth, rather than relying solely on market sentiment or past stock performance.
Chord Energy currently generates Free Cash Flow of $1.07 billion, suggesting a solid foundation for growth. Analyst forecasts provide annual estimates for the next five years. Further projections are extrapolated based on industry expectations. For example, projections show Free Cash Flow potentially reaching $1.28 billion by 2035, reflecting moderate and steady growth over the next decade. All values are presented in US dollars.
Based on the DCF calculation, Chord Energy's estimated fair value comes to $434.13 per share. Compared to its recent share price, this represents a 79.1% intrinsic discount. In other words, the stock is trading well below what long-term cash flow projections would suggest it is worth.
Result: UNDERVALUED
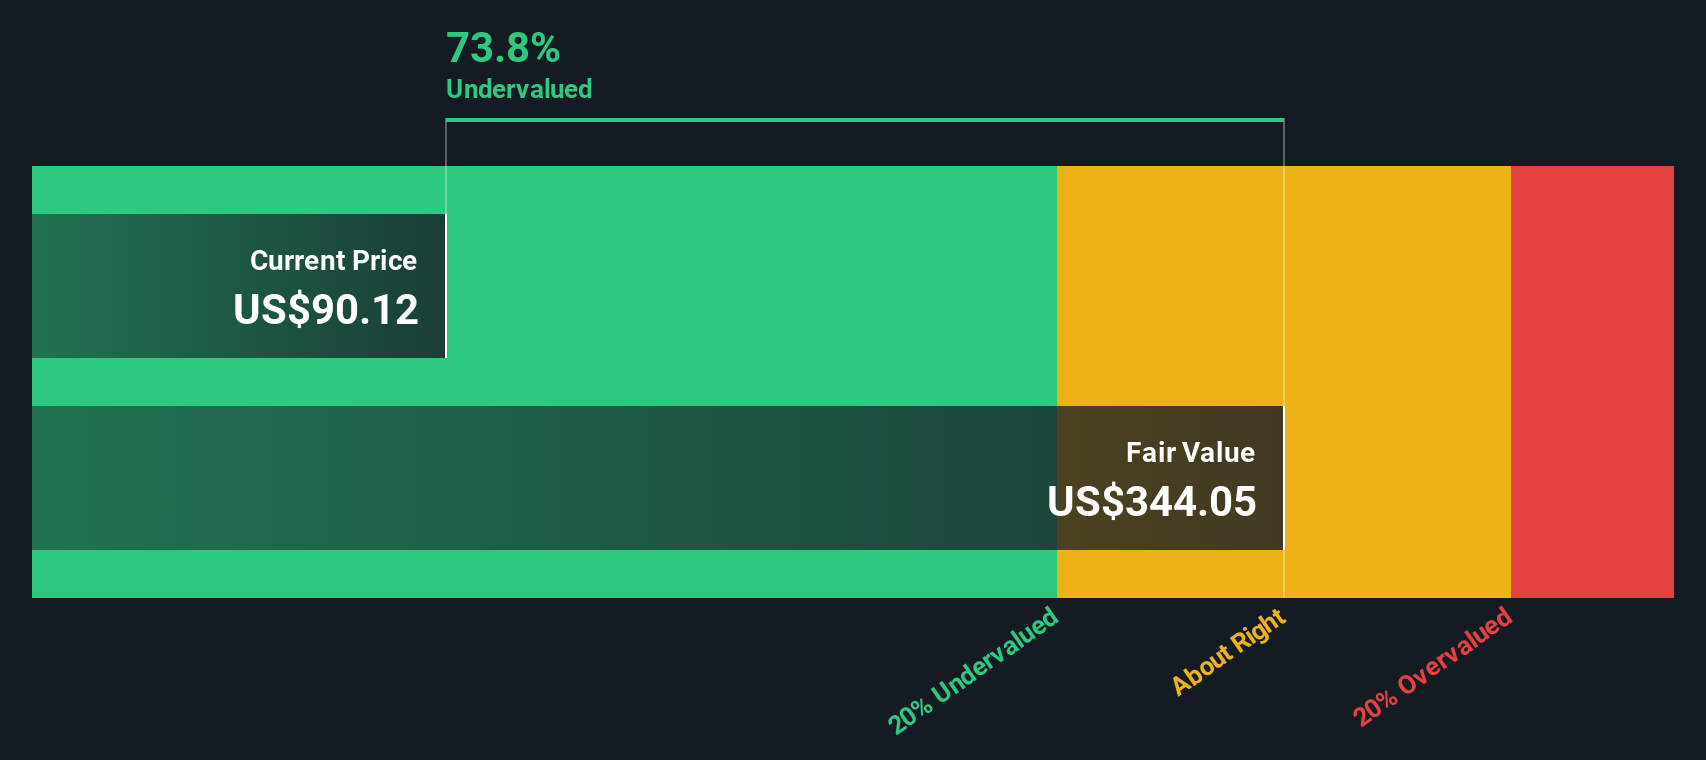
Our Discounted Cash Flow (DCF) analysis suggests Chord Energy is undervalued by 79.1%. Track this in your watchlist or portfolio, or discover more undervalued stocks.
Approach 2: Chord Energy Price vs Earnings
For profitable companies like Chord Energy, the Price-to-Earnings (PE) ratio is a popular and practical valuation metric. It tells investors how much they are paying for each dollar of earnings, offering a straightforward way to compare companies regardless of their size. PE is especially helpful when a business has stable and positive earnings because it highlights whether those profits are being undervalued or overhyped by the market.
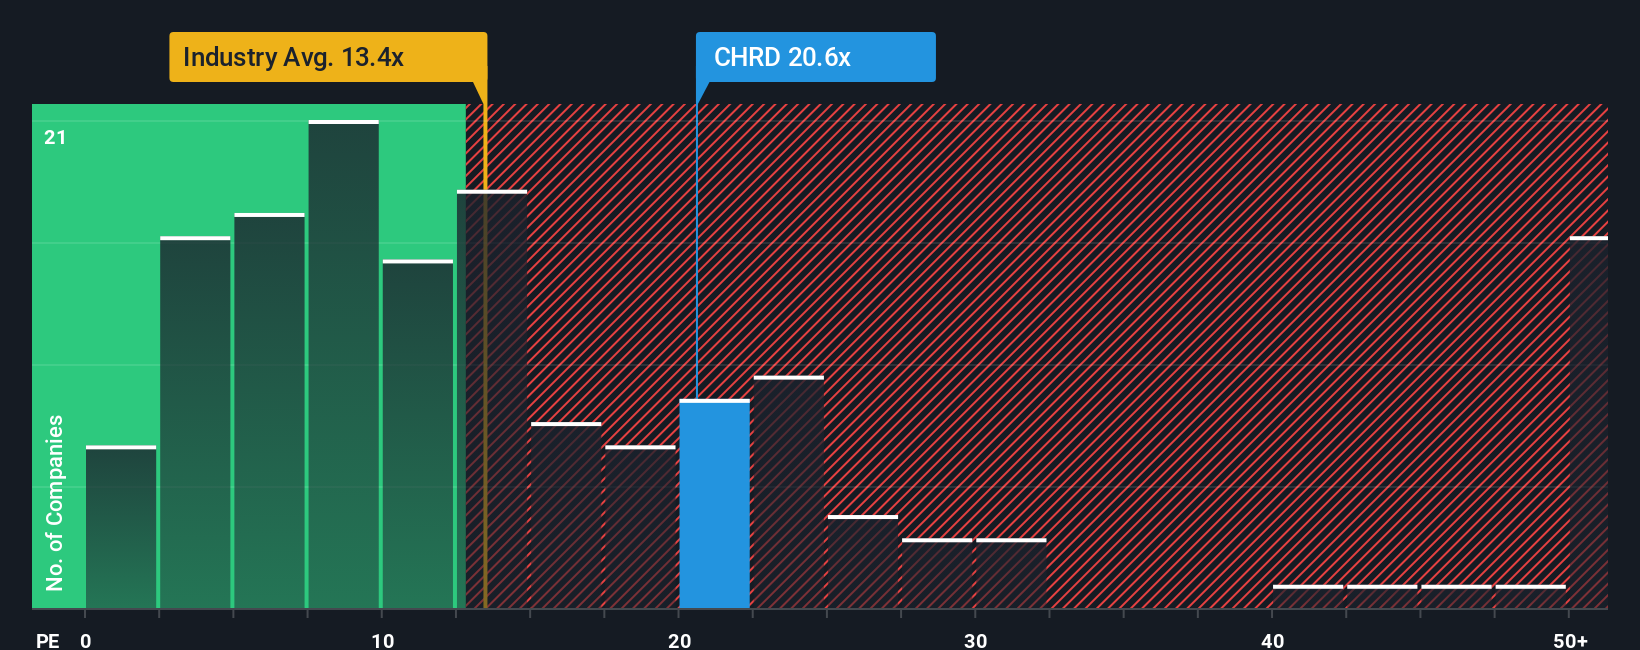
Of course, what counts as a “normal” or “fair” PE ratio depends on several factors. High growth prospects tend to justify a higher PE, while more risk or less consistent profits often mean a lower ratio is warranted. For Chord Energy, the current PE stands at 19.46x. That is above the industry average of 13.00x for oil and gas but well below the peer group’s average of 36.18x. This suggests the stock is priced more highly than typical industry players but still at a steep discount to some direct competitors.
Simply Wall St’s Fair Ratio takes this analysis further. It is a data-driven benchmark reflecting what the PE should be given Chord Energy’s own growth, profitability, risk, market cap, and sector characteristics. Unlike raw industry or peer averages, the Fair Ratio aims to be personalized and balanced, so it is a much better proxy for the true value investors should focus on.
Chord Energy’s Fair Ratio is 21.08x. The current PE is only slightly lower, at 19.46x. This small gap suggests that the market’s pricing for Chord Energy is roughly in line with what the company’s fundamentals deserve right now.
Result: ABOUT RIGHT
PE ratios tell one story, but what if the real opportunity lies elsewhere? Discover companies where insiders are betting big on explosive growth.
Upgrade Your Decision Making: Choose your Chord Energy Narrative
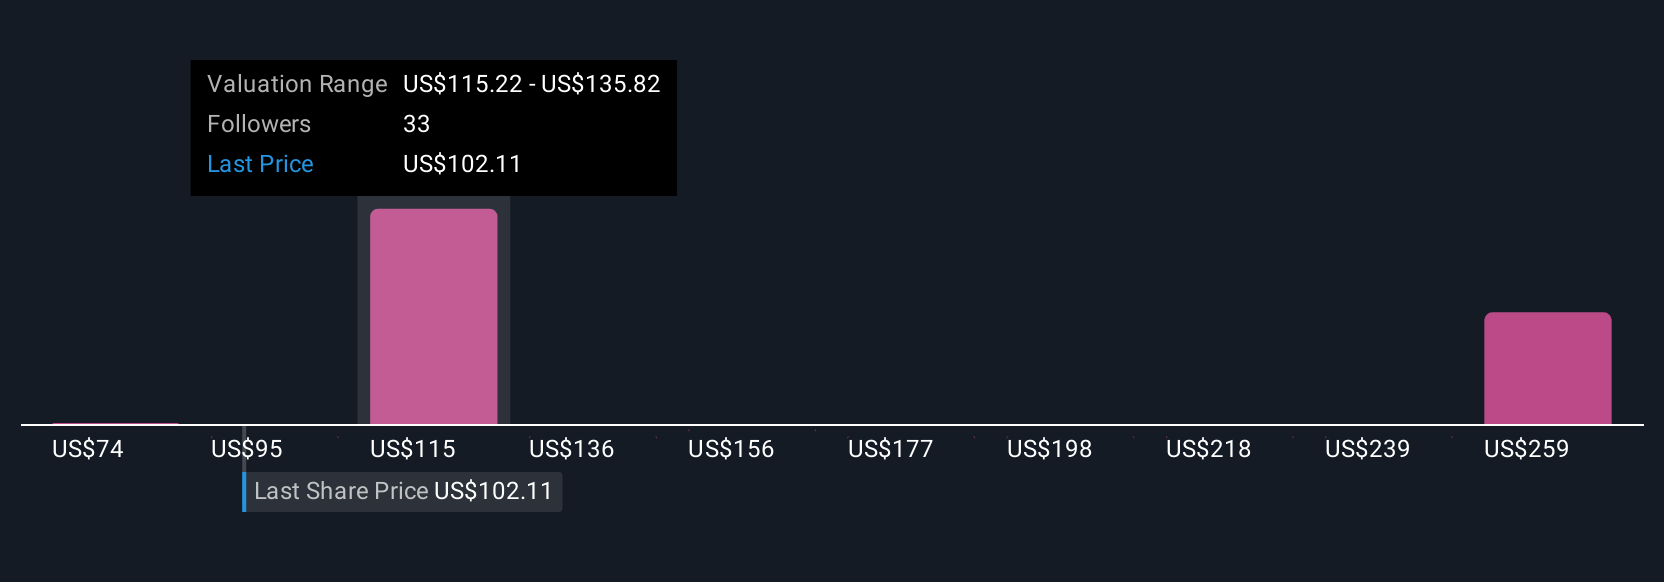
Earlier, we mentioned that there is an even better way to understand valuation. Let us introduce you to Narratives. A Narrative is simply your unique story about Chord Energy’s future, combining the business’s latest news, your assumptions about key financials like revenue, margins, or risks, and the fair value you estimate from those projections. Narratives link the “why” behind the numbers to a concrete financial forecast, helping you see not just what a stock is worth but why you believe it should be worth that much. On Simply Wall St’s Community page, used by millions, creating or exploring Narratives is easy and intuitive, with tools designed for all experience levels. Narratives help you decide when to buy or sell by directly comparing your fair value estimate to the current price, and they update dynamically whenever fresh announcements or earnings change the landscape. For example, looking at Chord Energy, some users have posted bullish Narratives, seeing operational innovation and AI adoption supporting a $166 fair value, while others note regulatory risks and assign a much lower value of $105. This demonstrates how your personal perspective, combined with up-to-date data, powers your smartest investment decisions.
Do you think there's more to the story for Chord Energy? Create your own Narrative to let the Community know!
This article by Simply Wall St is general in nature. We provide commentary based on historical data and analyst forecasts only using an unbiased methodology and our articles are not intended to be financial advice. It does not constitute a recommendation to buy or sell any stock, and does not take account of your objectives, or your financial situation. We aim to bring you long-term focused analysis driven by fundamental data. Note that our analysis may not factor in the latest price-sensitive company announcements or qualitative material. Simply Wall St has no position in any stocks mentioned.
New: AI Stock Screener & Alerts
Our new AI Stock Screener scans the market every day to uncover opportunities.
• Dividend Powerhouses (3%+ Yield)
• Undervalued Small Caps with Insider Buying
• High growth Tech and AI Companies
Or build your own from over 50 metrics.
Have feedback on this article? Concerned about the content? Get in touch with us directly. Alternatively, email editorial-team@simplywallst.com
About NasdaqGS:CHRD
Chord Energy
Operates as an independent exploration and production company in the United States.
Undervalued with adequate balance sheet.
Similar Companies
Market Insights

Advertisement
Community Narratives
A formidable player in AI and enterprise computing.
Fair Value US$210.00|3.9% overvalued
CO
Community Contributor
IREN's Bold Moves in Sustainable Bitcoin Mining & AI Data Centers
Fair Value US$72.52|4.1% undervalued
BL
Community Contributor
Cooling the Champions: The Aussie Tech Behind F1's Victories
Fair Value AU$12.40|39.4% undervalued
TR
Community Contributor