
Advertisement
- United States
- /
- Oil and Gas
- /
- NasdaqCM:CETY
Take Care Before Jumping Onto Clean Energy Technologies, Inc. (NASDAQ:CETY) Even Though It's 27% Cheaper
Clean Energy Technologies, Inc. (NASDAQ:CETY) shareholders that were waiting for something to happen have been dealt a blow with a 27% share price drop in the last month. The drop over the last 30 days has capped off a tough year for shareholders, with the share price down 40% in that time.
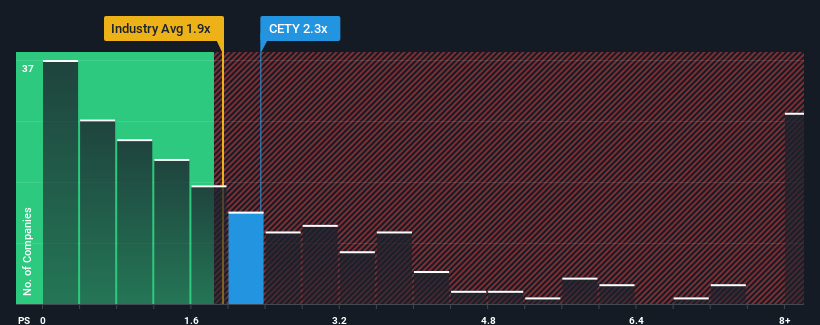
Even after such a large drop in price, it's still not a stretch to say that Clean Energy Technologies' price-to-sales (or "P/S") ratio of 2.3x right now seems quite "middle-of-the-road" compared to the Oil and Gas industry in the United States, where the median P/S ratio is around 1.9x. Although, it's not wise to simply ignore the P/S without explanation as investors may be disregarding a distinct opportunity or a costly mistake.
See our latest analysis for Clean Energy Technologies
What Does Clean Energy Technologies' P/S Mean For Shareholders?
Recent times have been quite advantageous for Clean Energy Technologies as its revenue has been rising very briskly. Perhaps the market is expecting future revenue performance to taper off, which has kept the P/S from rising. If that doesn't eventuate, then existing shareholders have reason to be feeling optimistic about the future direction of the share price.
Want the full picture on earnings, revenue and cash flow for the company? Then our free report on Clean Energy Technologies will help you shine a light on its historical performance.Is There Some Revenue Growth Forecasted For Clean Energy Technologies?
The only time you'd be comfortable seeing a P/S like Clean Energy Technologies' is when the company's growth is tracking the industry closely.
Retrospectively, the last year delivered an explosive gain to the company's top line. The amazing performance means it was also able to deliver huge revenue growth over the last three years. Therefore, it's fair to say the revenue growth recently has been superb for the company.
Comparing that recent medium-term revenue trajectory with the industry's one-year growth forecast of 6.7% shows it's noticeably more attractive.
In light of this, it's curious that Clean Energy Technologies' P/S sits in line with the majority of other companies. Apparently some shareholders believe the recent performance is at its limits and have been accepting lower selling prices.
What Does Clean Energy Technologies' P/S Mean For Investors?
Clean Energy Technologies' plummeting stock price has brought its P/S back to a similar region as the rest of the industry. We'd say the price-to-sales ratio's power isn't primarily as a valuation instrument but rather to gauge current investor sentiment and future expectations.
We didn't quite envision Clean Energy Technologies' P/S sitting in line with the wider industry, considering the revenue growth over the last three-year is higher than the current industry outlook. It'd be fair to assume that potential risks the company faces could be the contributing factor to the lower than expected P/S. At least the risk of a price drop looks to be subdued if recent medium-term revenue trends continue, but investors seem to think future revenue could see some volatility.
It's always necessary to consider the ever-present spectre of investment risk. We've identified 4 warning signs with Clean Energy Technologies (at least 1 which can't be ignored), and understanding them should be part of your investment process.
Of course, profitable companies with a history of great earnings growth are generally safer bets. So you may wish to see this free collection of other companies that have reasonable P/E ratios and have grown earnings strongly.
New: AI Stock Screener & Alerts
Our new AI Stock Screener scans the market every day to uncover opportunities.
• Dividend Powerhouses (3%+ Yield)
• Undervalued Small Caps with Insider Buying
• High growth Tech and AI Companies
Or build your own from over 50 metrics.
Have feedback on this article? Concerned about the content? Get in touch with us directly. Alternatively, email editorial-team (at) simplywallst.com.
This article by Simply Wall St is general in nature. We provide commentary based on historical data and analyst forecasts only using an unbiased methodology and our articles are not intended to be financial advice. It does not constitute a recommendation to buy or sell any stock, and does not take account of your objectives, or your financial situation. We aim to bring you long-term focused analysis driven by fundamental data. Note that our analysis may not factor in the latest price-sensitive company announcements or qualitative material. Simply Wall St has no position in any stocks mentioned.
About NasdaqCM:CETY
Clean Energy Technologies
Designs, produces, and markets clean energy products and integrated solutions that focuses on energy efficiency and renewable energy in the United States and internationally.
Flawless balance sheet with moderate risk.
Market Insights


Advertisement
Community Narratives
America Wants Homegrown Drones — Draganfly Is Ready to Deliver
Fair Value US$9.21|27.4% undervalued
JO
Community Contributor
Cheesecake Factory offers an enticing opportunity for long-term growth by leveraging new concepts
Fair Value US$73.83|25.8% undervalued
ZW
Community Contributor
Coca-Cola’s Intrinsic Value Set to Rise with Fed Rate Cut
Fair Value US$67.50|2.7% undervalued
AL
Community Contributor
Fully Permitted Gold Mine with 50 Baggers Potential 
Fair Value CA$41.00|98.0% undervalued
RO
Community Contributor