Advertisement
- United States
- /
- Diversified Financial
- /
- NYSE:RDN
Are Radian Group Shares Poised for Growth After Five-Year 124% Rally?

Simply Wall St
Reviewed by Bailey Pemberton
Wondering what to make of Radian Group stock right now? If you're reevaluating your portfolio or just like to keep an eye out for undervalued opportunities, Radian's recent price action may have you leaning in for a closer look. Sure, the stock slipped by 4.4% this past week, and it’s slightly down over the last month. But when you zoom out, it’s hard not to notice the bigger picture: up 9.2% year-to-date, 5.2% over the past year, and a remarkable 124.5% gain over the last five years. That long-term uptrend suggests a story that’s more about growth and evolving risk perceptions than short-term jitters.
When market developments shift sentiment around housing finance and mortgage risk, stocks like Radian Group can see quick changes in momentum. Yet, underneath those fluctuations, the company’s value story holds steady. According to our thorough valuation screening, Radian earns a value score of 5 out of 6, ticking nearly every box for being undervalued. That is not the kind of score you see every day, especially after a multi-year run of outperformance.
So, what goes into that valuation score, and does it actually hold up when you peel back the layers? In the next section, we'll break down the different approaches investors use to measure a stock’s value, and later, we will talk about a method that may offer an even clearer perspective.
Why Radian Group is lagging behind its peers
Approach 1: Radian Group Excess Returns Analysis
The Excess Returns model evaluates how effectively Radian Group converts its equity into profits, above and beyond the minimum returns required by shareholders. This approach spotlights persistent profitability and the company’s power to create value from its investments, not just raw earnings but what is left after meeting the cost of equity.
Radian Group’s key metrics reinforce a compelling value case. The company posts a book value of $33.18 per share and generates a stable earnings per share of $5.18, sourced from the median return on equity over the past five years. With a cost of equity at $2.90 per share, Radian’s excess return stands at $2.28 per share. Its average return on equity is a strong 13.74%, and future projections set the stable book value at $37.66 per share, based on a weighted average outlook from four analysts.
According to this model, Radian’s intrinsic value is $87.06 per share. That figure is roughly 60% above the current trading price, signaling the stock may be significantly undervalued based on excess returns expectations. This substantial discount suggests investors could be overlooking the company’s core profitability and long-term growth capacity.
Result: UNDERVALUED
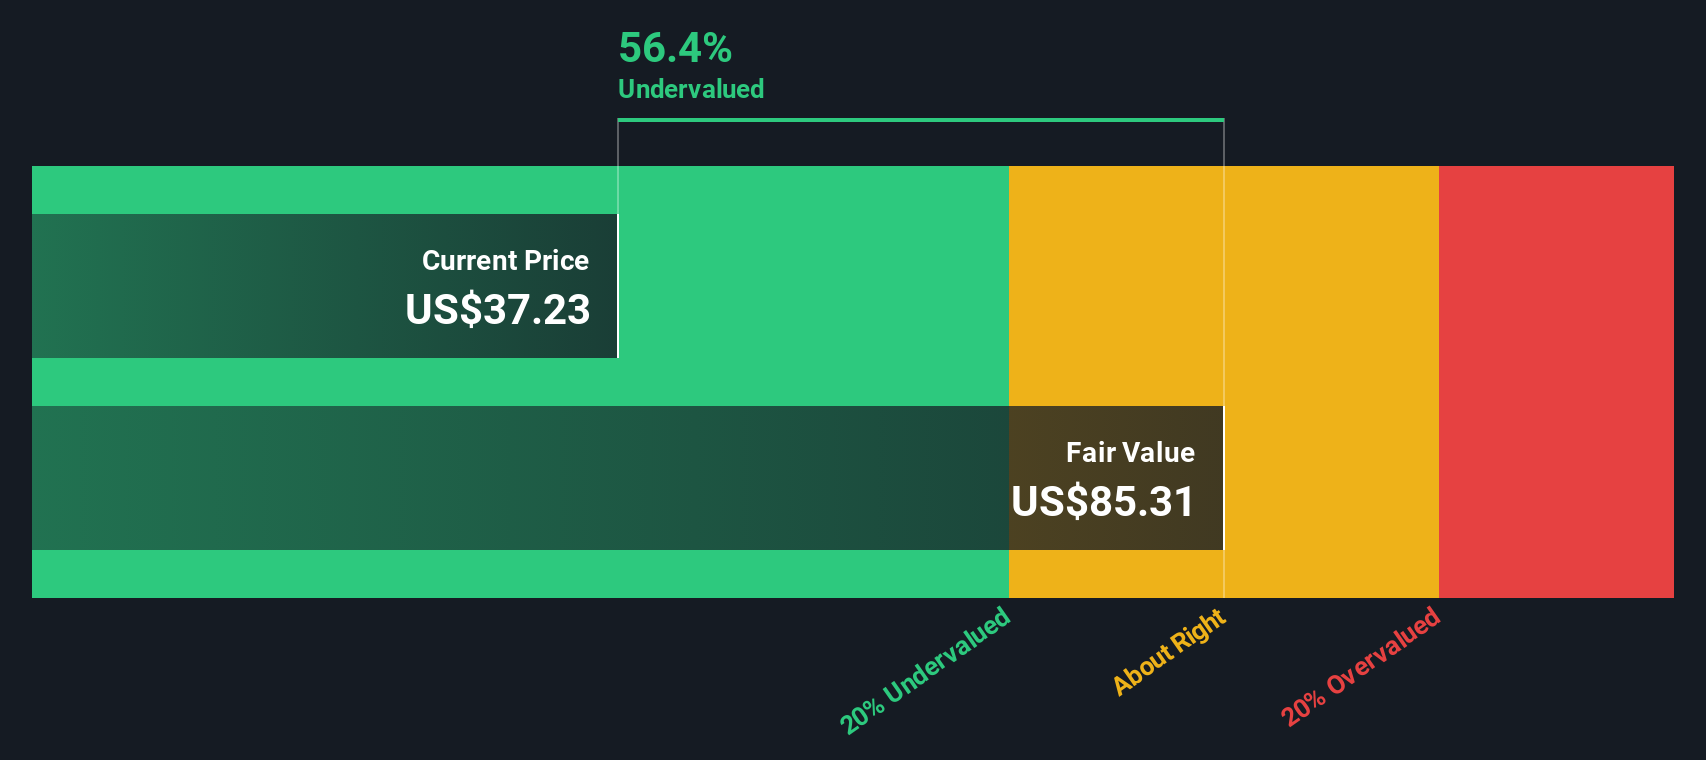
Our Excess Returns analysis suggests Radian Group is undervalued by 60.0%. Track this in your watchlist or portfolio, or discover more undervalued stocks.
Approach 2: Radian Group Price vs Earnings
The price-to-earnings (PE) ratio is a popular and practical valuation metric for established, profitable companies like Radian Group. It helps investors gauge how much they are paying for a dollar of earnings, offering an accessible way to compare valuations across similar firms. PE ratios are influenced by growth prospects and perceived risk. Higher expected growth or lower risk typically justifies a higher PE, while slower growth or greater uncertainty pushes it down.
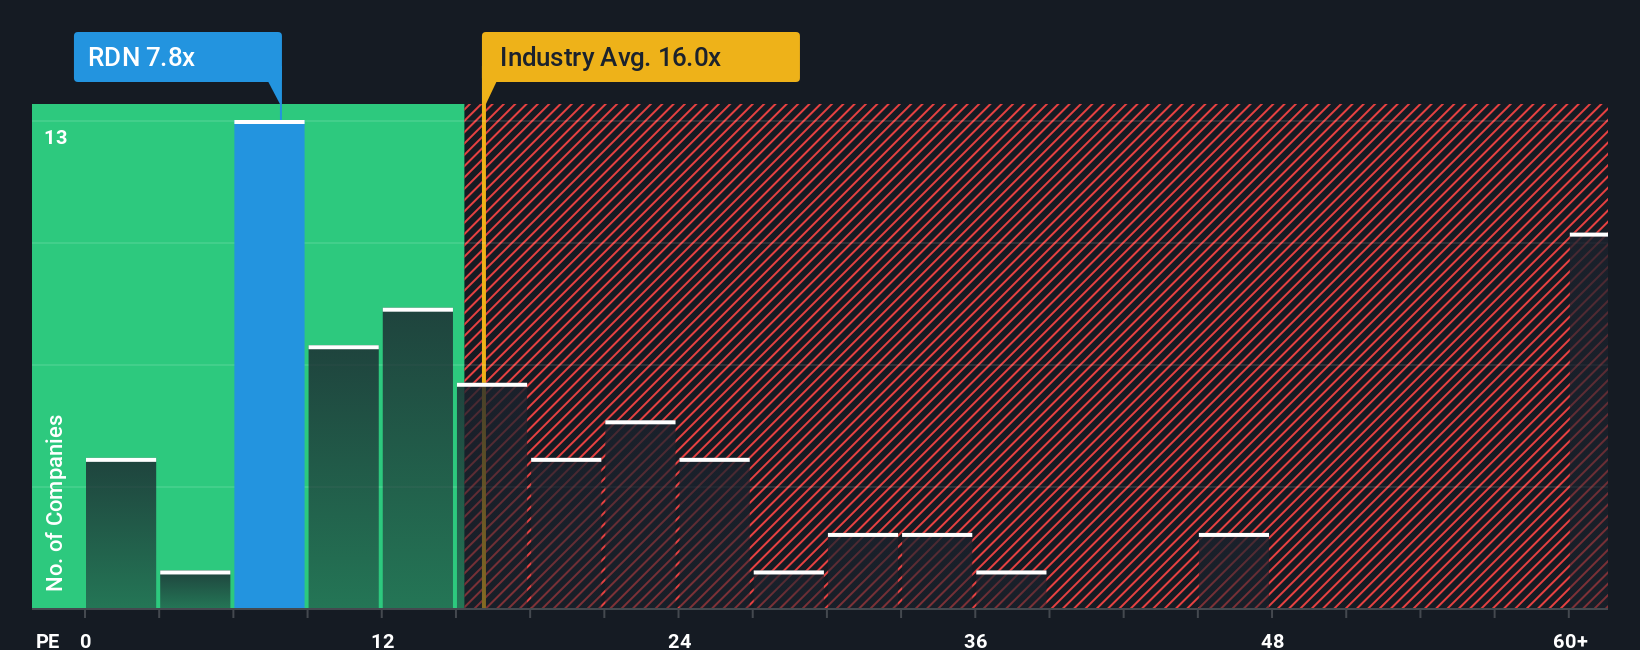
Radian Group currently trades at a PE ratio of 8.05x. For context, this sits well below the Diversified Financial industry average of 16.47x and also trails the average of its direct listed peers at 10.31x. By traditional methods, such a low PE could signal the market is undervaluing the company’s current earnings relative to its broader industry.
However, the “Fair Ratio” calculated by Simply Wall St provides a more tailored benchmark. This metric integrates not only industry positioning and size, but also Radian’s own earnings growth, risk profile, and profitability. For Radian, the Fair Ratio is estimated at 12.54x, reflecting the multiple the company might reasonably command given its fundamentals. Unlike a simple peer comparison, the Fair Ratio adjusts for nuances like anticipated earnings trends and sector-specific risks, making it a more comprehensive guide. With Radian’s current PE of 8.05x sitting well below its Fair Ratio, the evidence suggests the stock is undervalued by this approach.
Result: UNDERVALUED
PE ratios tell one story, but what if the real opportunity lies elsewhere? Discover companies where insiders are betting big on explosive growth.
Upgrade Your Decision Making: Choose your Radian Group Narrative
Earlier we mentioned that there is an even better way to understand valuation, so let’s introduce you to Narratives, a simple yet powerful way to connect a company’s story to financial forecasts and fair value calculations. A Narrative lets you express your personal take on Radian Group by plugging in your own expectations for things like future revenue, earnings, and margins, turning numbers into a story that makes sense to you.
On Simply Wall St’s Community page, millions of investors use Narratives to map out their opinions, seamlessly tying a business’s outlook to an automatically updated forecast and fair value. This tool helps you decide whether Radian is a buy or a sell by showing you the gap between current price and what you believe the stock is really worth. The Narrative stays up to date as new earnings or news emerges, so your investment view evolves in real time.
For example, one Narrative for Radian Group might highlight strong housing demand and data-driven risk management, resulting in a fair value of $38.67 per share. A more cautious Narrative, focusing on lagging diversification and regulatory risk, might see little upside above today’s price and offers a clear illustration of how differing perspectives shape smart, dynamic decision making.
Do you think there's more to the story for Radian Group? Create your own Narrative to let the Community know!
This article by Simply Wall St is general in nature. We provide commentary based on historical data and analyst forecasts only using an unbiased methodology and our articles are not intended to be financial advice. It does not constitute a recommendation to buy or sell any stock, and does not take account of your objectives, or your financial situation. We aim to bring you long-term focused analysis driven by fundamental data. Note that our analysis may not factor in the latest price-sensitive company announcements or qualitative material. Simply Wall St has no position in any stocks mentioned.
New: AI Stock Screener & Alerts
Our new AI Stock Screener scans the market every day to uncover opportunities.
• Dividend Powerhouses (3%+ Yield)
• Undervalued Small Caps with Insider Buying
• High growth Tech and AI Companies
Or build your own from over 50 metrics.
Have feedback on this article? Concerned about the content? Get in touch with us directly. Alternatively, email editorial-team@simplywallst.com
About NYSE:RDN
Radian Group
Engages in the mortgage and real estate services business in the United States.
Undervalued average dividend payer.
Market Insights

Advertisement
Community Narratives
A formidable player in AI and enterprise computing.
Fair Value US$210.00|2.3% overvalued
CO
Community Contributor
IREN's Bold Moves in Sustainable Bitcoin Mining & AI Data Centers
Fair Value US$72.52|17.6% undervalued
BL
Community Contributor
Cooling the Champions: The Aussie Tech Behind F1's Victories
Fair Value AU$12.40|40.4% undervalued
TR
Community Contributor