Advertisement
- United States
- /
- Capital Markets
- /
- NYSE:OWL
Can Blue Owl Capital’s Valuation Justify the Surge After Leading Meta’s $29B Financing?

Simply Wall St
Reviewed by Bailey Pemberton
If you have been watching Blue Owl Capital lately, you are probably wondering whether this is the moment to act or to wait things out. After a notable roller coaster over the last few months, it is no surprise investors are debating their next move. In the past seven days, the stock bounced up by 3.7%, offering a sigh of relief for those stung by the broader selloff in recent months. Still, zoom out and the year-to-date return sits at -27.4%, while the past year shows a -20.4% slide. Yet, there is a striking long-term twist: over three years, the stock has rocketed ahead by 114.9%.
So, what is behind these moves? Part of the story lies in recent headlines. News of Blue Owl teaming up with Goldman Sachs on a $1.5 billion asset manager portfolio sale and playing a key role in Meta’s massive $29 billion financing effort has put the company in the spotlight again. Adding fuel, some analysts have even bumped up price targets. These high-profile deals suggest both rising ambitions and evolving risks as Blue Owl continues to carve out its market space.
But let’s be candid, valuation matters—especially with big swings like these. Out of six typical checks for undervaluation, Blue Owl scores just a 1. That means on the surface, it appears only slightly undervalued by standard metrics. Still, before you rush to a conclusion, let’s dive into the different valuation approaches and see what they really say about Blue Owl’s future potential. Plus, stick around for an even better angle on valuation that you will not want to miss.
Blue Owl Capital scores just 1/6 on our valuation checks. See what other red flags we found in the full valuation breakdown.
Approach 1: Blue Owl Capital Excess Returns Analysis
The Excess Returns valuation model measures how effectively a company generates profit from its equity base, above and beyond what investors could expect from simply taking on the company’s risk profile. In essence, it tells us if Blue Owl Capital is earning enough on shareholders’ invested capital after accounting for the cost of equity.
- Book Value: $3.61 per share
- Stable EPS: $0.14 per share
(Source: Median Return on Equity from the past 5 years.) - Cost of Equity: $0.30 per share
- Excess Return: $-0.16 per share
- Average Return on Equity: 3.98%
- Stable Book Value: $3.53 per share
(Source: Median Book Value from the past 5 years.)
According to this model, Blue Owl is not currently generating returns in excess of its cost of equity. Its excess return stands at negative $0.16 per share. This is a signal that, relative to the capital invested, the earnings are not robust given the risk undertaken by investors. The estimated intrinsic value is far below the current share price, indicating the stock is 2789.7% overvalued based on excess returns analysis.
Result: OVERVALUED
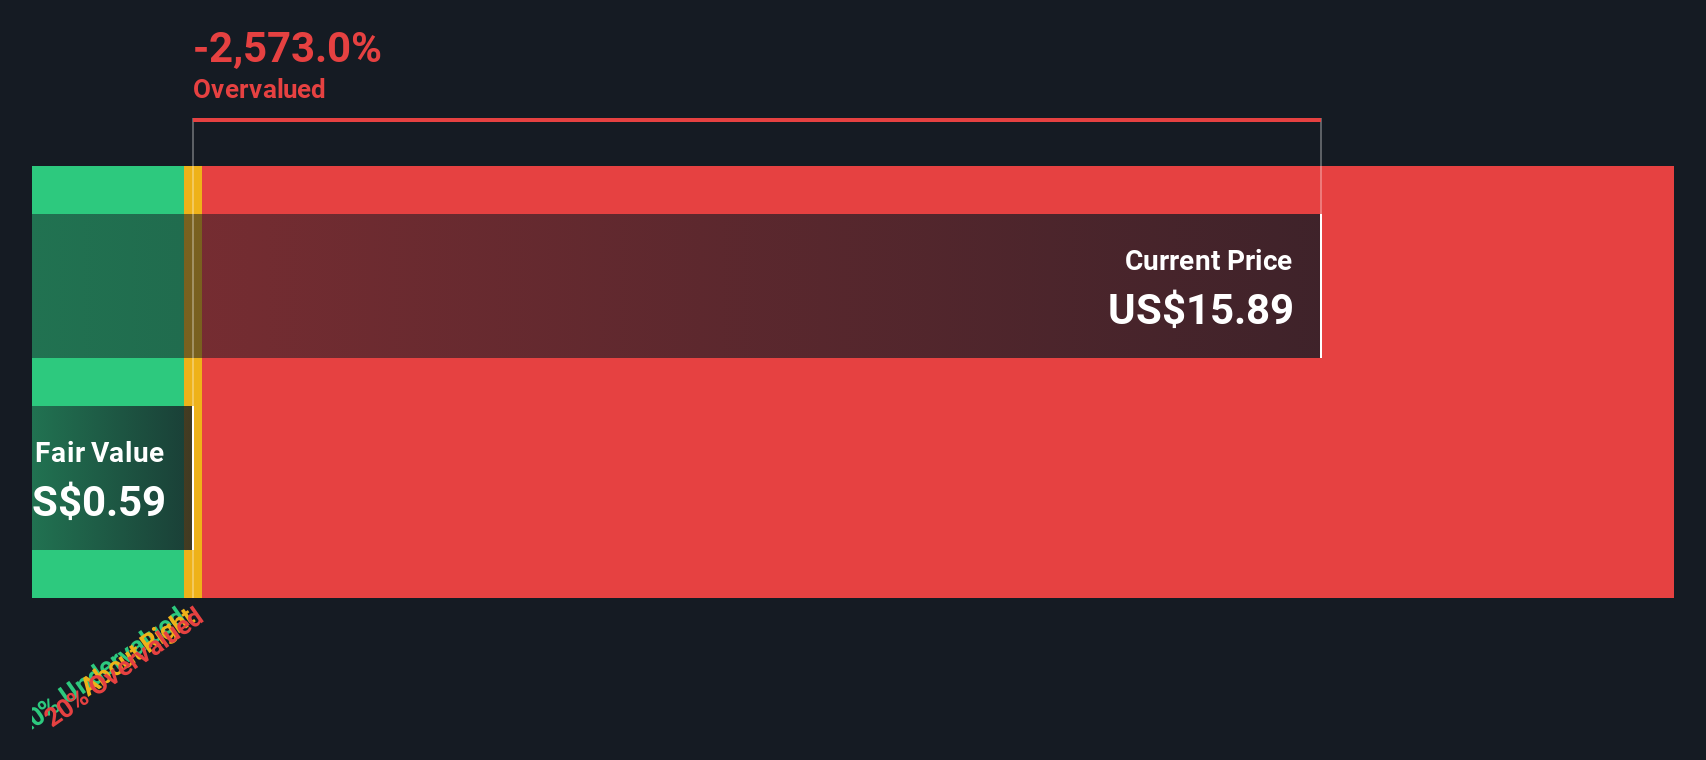
Our Excess Returns analysis suggests Blue Owl Capital may be overvalued by 2789.7%. Find undervalued stocks or create your own screener to find better value opportunities.
Approach 2: Blue Owl Capital Price vs Earnings
For companies that are profitable, the Price-to-Earnings (PE) ratio is a widely used benchmark because it measures how much investors are willing to pay today for a dollar of current earnings. This ratio helps evaluate whether a stock is expensive or cheap relative to its earnings power. The “right” PE ratio depends on how fast a company is expected to grow and the risks involved. It is important to look beyond just the surface number.
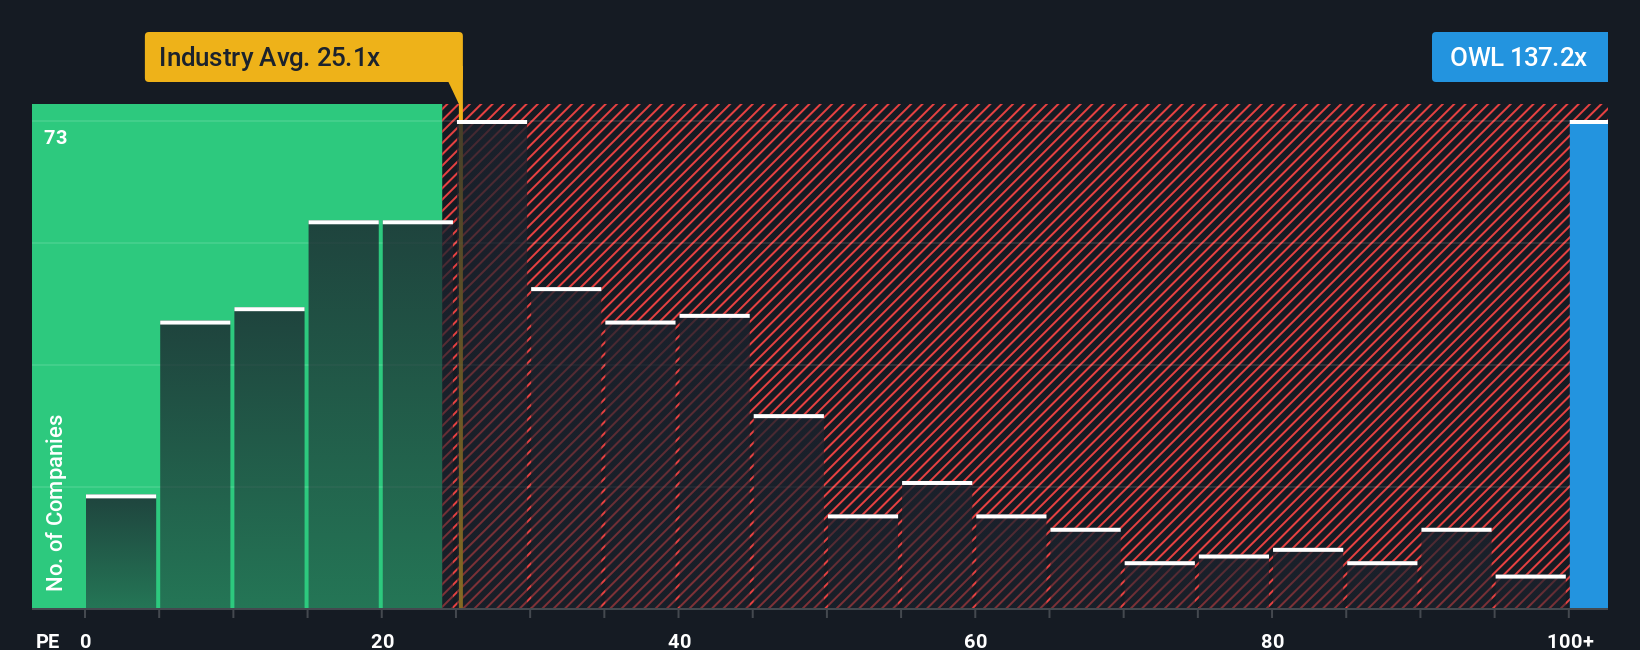
Blue Owl Capital currently has a PE ratio of 147.8x, which is significantly higher than both the industry average of 25.7x for capital markets companies and the average of selected peers at 14.0x. At a glance, this would suggest high growth expectations or possibly a premium for its market position, but it can also indicate an overheated valuation relative to profits today.
To get a more tailored valuation reading, Simply Wall St’s proprietary “Fair Ratio” for Blue Owl is 52.2x. This metric stands out because, unlike broad peer or industry averages, it factors in the company’s specific growth prospects, margins, size, and sector risks. It aims to reflect what an objective, informed investor might actually be willing to pay under current conditions, not just how the market feels today or how peers are valued.
Since Blue Owl Capital’s actual PE multiple of 147.8x is well above its Fair Ratio of 52.2x, the shares look expensive on a comparable basis. In short, the stock trades at a substantial premium even after accounting for its unique qualities and prospects.
Result: OVERVALUED
PE ratios tell one story, but what if the real opportunity lies elsewhere? Discover companies where insiders are betting big on explosive growth.
Upgrade Your Decision Making: Choose your Blue Owl Capital Narrative
Earlier, we mentioned there is an even better way to understand valuation, so let’s introduce you to Narratives. Narratives are stories that investors build about a company’s future. They give context to the numbers by linking your assumptions about where Blue Owl Capital is heading (revenue, earnings, margins) directly to a calculated fair value.
This approach connects the “why” behind a stock’s outlook with the financial forecast and the share price you believe is reasonable. On Simply Wall St’s Community page, millions of investors are already using Narratives as an easy and interactive tool to capture their perspective and compare it with others.
With Narratives, you can quickly see whether the fair value based on your story is above or below today’s price, making it clearer when you might want to buy, hold, or sell. Even better, Narratives stay up to date. They adjust automatically when fresh data or news arrives, so your view remains relevant as the facts change.
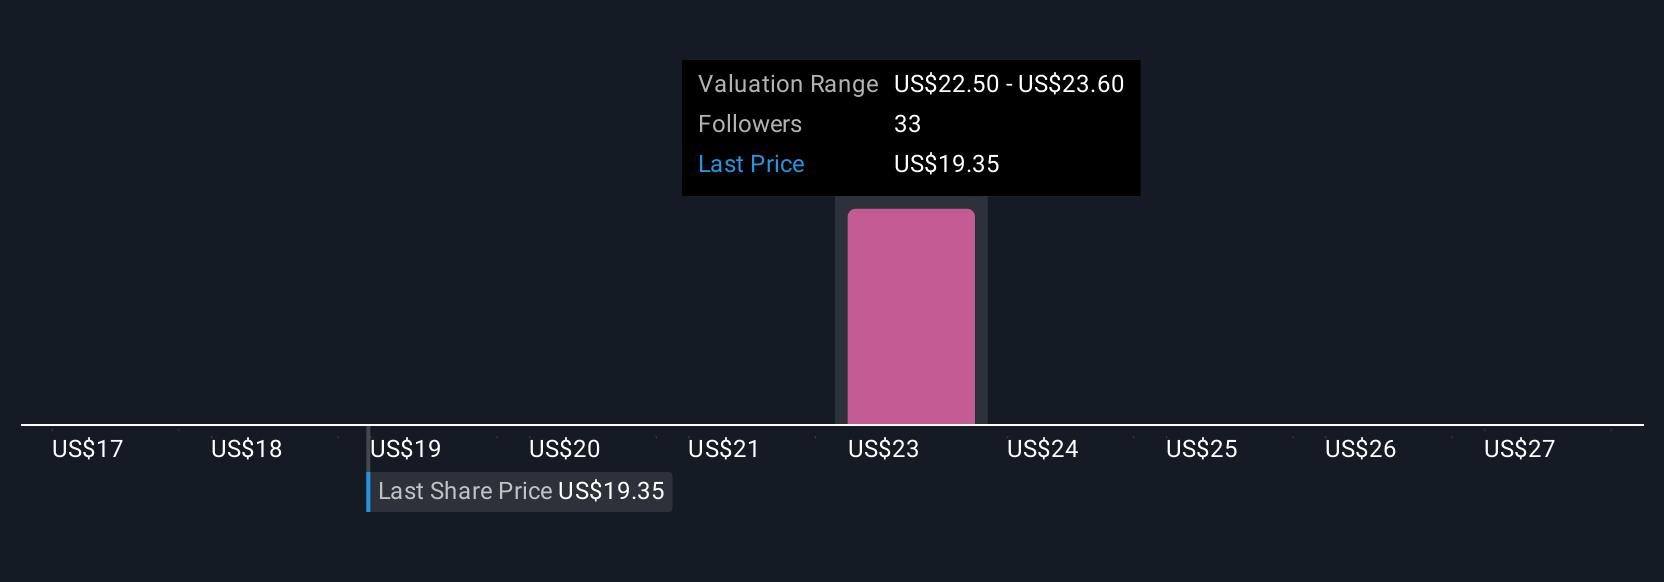
For example, some investors believe Blue Owl Capital’s growth in digital infrastructure and stable fees will drive fair value as high as $29.00, while more cautious perspectives focusing on market risks see it closer to $21.00.
Do you think there's more to the story for Blue Owl Capital? Create your own Narrative to let the Community know!
This article by Simply Wall St is general in nature. We provide commentary based on historical data and analyst forecasts only using an unbiased methodology and our articles are not intended to be financial advice. It does not constitute a recommendation to buy or sell any stock, and does not take account of your objectives, or your financial situation. We aim to bring you long-term focused analysis driven by fundamental data. Note that our analysis may not factor in the latest price-sensitive company announcements or qualitative material. Simply Wall St has no position in any stocks mentioned.
Valuation is complex, but we're here to simplify it.
Discover if Blue Owl Capital might be undervalued or overvalued with our detailed analysis, featuring fair value estimates, potential risks, dividends, insider trades, and its financial condition.
Access Free AnalysisHave feedback on this article? Concerned about the content? Get in touch with us directly. Alternatively, email editorial-team@simplywallst.com
About NYSE:OWL
Blue Owl Capital
Operates as an alternative asset manager in the United States.
High growth potential with adequate balance sheet.
Similar Companies
Market Insights

Advertisement
Community Narratives
A formidable player in AI and enterprise computing.
Fair Value US$210.00|13.6% overvalued
CO
Community Contributor
IREN's Bold Moves in Sustainable Bitcoin Mining & AI Data Centers
Fair Value US$89.00|23.6% undervalued
BL
Community Contributor
Cooling the Champions: The Aussie Tech Behind F1's Victories
Fair Value AU$12.40|37.6% undervalued
TR
Community Contributor