- United States
- /
- Consumer Finance
- /
- NYSE:ML
MoneyLion Inc.'s (NYSE:ML) 27% Share Price Plunge Could Signal Some Risk


MoneyLion Inc. (NYSE:ML) shares have retraced a considerable 27% in the last month, reversing a fair amount of their solid recent performance. Looking at the bigger picture, even after this poor month the stock is up 98% in the last year.
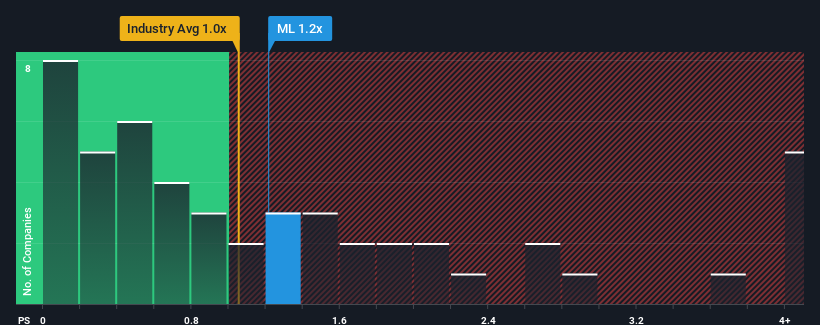
Although its price has dipped substantially, there still wouldn't be many who think MoneyLion's price-to-sales (or "P/S") ratio of 1.2x is worth a mention when the median P/S in the United States' Consumer Finance industry is similar at about 1x. While this might not raise any eyebrows, if the P/S ratio is not justified investors could be missing out on a potential opportunity or ignoring looming disappointment.
See our latest analysis for MoneyLion
What Does MoneyLion's Recent Performance Look Like?
With revenue growth that's superior to most other companies of late, MoneyLion has been doing relatively well. Perhaps the market is expecting this level of performance to taper off, keeping the P/S from soaring. If you like the company, you'd be hoping this isn't the case so that you could potentially pick up some stock while it's not quite in favour.
Keen to find out how analysts think MoneyLion's future stacks up against the industry? In that case, our free report is a great place to start.How Is MoneyLion's Revenue Growth Trending?
There's an inherent assumption that a company should be matching the industry for P/S ratios like MoneyLion's to be considered reasonable.
Taking a look back first, we see that the company grew revenue by an impressive 35% last year. The latest three year period has also seen an incredible overall rise in revenue, aided by its incredible short-term performance. So we can start by confirming that the company has done a tremendous job of growing revenue over that time.
Shifting to the future, estimates from the four analysts covering the company suggest revenue should grow by 21% over the next year. Meanwhile, the rest of the industry is forecast to expand by 31%, which is noticeably more attractive.
With this information, we find it interesting that MoneyLion is trading at a fairly similar P/S compared to the industry. Apparently many investors in the company are less bearish than analysts indicate and aren't willing to let go of their stock right now. Maintaining these prices will be difficult to achieve as this level of revenue growth is likely to weigh down the shares eventually.
What We Can Learn From MoneyLion's P/S?
With its share price dropping off a cliff, the P/S for MoneyLion looks to be in line with the rest of the Consumer Finance industry. It's argued the price-to-sales ratio is an inferior measure of value within certain industries, but it can be a powerful business sentiment indicator.
Our look at the analysts forecasts of MoneyLion's revenue prospects has shown that its inferior revenue outlook isn't negatively impacting its P/S as much as we would have predicted. At present, we aren't confident in the P/S as the predicted future revenues aren't likely to support a more positive sentiment for long. Circumstances like this present a risk to current and prospective investors who may see share prices fall if the low revenue growth impacts the sentiment.
We don't want to rain on the parade too much, but we did also find 3 warning signs for MoneyLion that you need to be mindful of.
If strong companies turning a profit tickle your fancy, then you'll want to check out this free list of interesting companies that trade on a low P/E (but have proven they can grow earnings).
New: Manage All Your Stock Portfolios in One Place
We've created the ultimate portfolio companion for stock investors, and it's free.
• Connect an unlimited number of Portfolios and see your total in one currency
• Be alerted to new Warning Signs or Risks via email or mobile
• Track the Fair Value of your stocks
Have feedback on this article? Concerned about the content? Get in touch with us directly. Alternatively, email editorial-team (at) simplywallst.com.
This article by Simply Wall St is general in nature. We provide commentary based on historical data and analyst forecasts only using an unbiased methodology and our articles are not intended to be financial advice. It does not constitute a recommendation to buy or sell any stock, and does not take account of your objectives, or your financial situation. We aim to bring you long-term focused analysis driven by fundamental data. Note that our analysis may not factor in the latest price-sensitive company announcements or qualitative material. Simply Wall St has no position in any stocks mentioned.
About NYSE:ML
MoneyLion
A financial technology company, provides personalized products and financial content for consumers in the United States.
High growth potential with excellent balance sheet.
Similar Companies
Market Insights

Community Narratives

