
Advertisement
- United States
- /
- Consumer Finance
- /
- NYSE:ML
MoneyLion Inc. (NYSE:ML) Shares May Have Slumped 31% But Getting In Cheap Is Still Unlikely

The MoneyLion Inc. (NYSE:ML) share price has fared very poorly over the last month, falling by a substantial 31%. Of course, over the longer-term many would still wish they owned shares as the stock's price has soared 290% in the last twelve months.
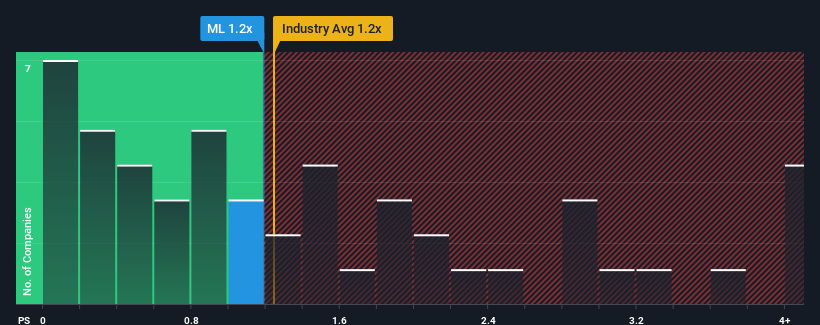
In spite of the heavy fall in price, it's still not a stretch to say that MoneyLion's price-to-sales (or "P/S") ratio of 1.2x right now seems quite "middle-of-the-road" compared to the Consumer Finance industry in the United States, seeing as it matches the P/S ratio of the wider industry. Although, it's not wise to simply ignore the P/S without explanation as investors may be disregarding a distinct opportunity or a costly mistake.
See our latest analysis for MoneyLion
What Does MoneyLion's Recent Performance Look Like?
Recent times have been advantageous for MoneyLion as its revenues have been rising faster than most other companies. One possibility is that the P/S ratio is moderate because investors think this strong revenue performance might be about to tail off. If you like the company, you'd be hoping this isn't the case so that you could potentially pick up some stock while it's not quite in favour.
If you'd like to see what analysts are forecasting going forward, you should check out our free report on MoneyLion.How Is MoneyLion's Revenue Growth Trending?
The only time you'd be comfortable seeing a P/S like MoneyLion's is when the company's growth is tracking the industry closely.
Retrospectively, the last year delivered an exceptional 24% gain to the company's top line. The latest three year period has also seen an incredible overall rise in revenue, aided by its incredible short-term performance. So we can start by confirming that the company has done a tremendous job of growing revenue over that time.
Looking ahead now, revenue is anticipated to climb by 22% during the coming year according to the four analysts following the company. With the industry predicted to deliver 32% growth, the company is positioned for a weaker revenue result.
In light of this, it's curious that MoneyLion's P/S sits in line with the majority of other companies. It seems most investors are ignoring the fairly limited growth expectations and are willing to pay up for exposure to the stock. These shareholders may be setting themselves up for future disappointment if the P/S falls to levels more in line with the growth outlook.
The Key Takeaway
Following MoneyLion's share price tumble, its P/S is just clinging on to the industry median P/S. While the price-to-sales ratio shouldn't be the defining factor in whether you buy a stock or not, it's quite a capable barometer of revenue expectations.
When you consider that MoneyLion's revenue growth estimates are fairly muted compared to the broader industry, it's easy to see why we consider it unexpected to be trading at its current P/S ratio. At present, we aren't confident in the P/S as the predicted future revenues aren't likely to support a more positive sentiment for long. Circumstances like this present a risk to current and prospective investors who may see share prices fall if the low revenue growth impacts the sentiment.
Before you take the next step, you should know about the 3 warning signs for MoneyLion that we have uncovered.
Of course, profitable companies with a history of great earnings growth are generally safer bets. So you may wish to see this free collection of other companies that have reasonable P/E ratios and have grown earnings strongly.
New: Manage All Your Stock Portfolios in One Place
We've created the ultimate portfolio companion for stock investors, and it's free.
• Connect an unlimited number of Portfolios and see your total in one currency
• Be alerted to new Warning Signs or Risks via email or mobile
• Track the Fair Value of your stocks
Have feedback on this article? Concerned about the content? Get in touch with us directly. Alternatively, email editorial-team (at) simplywallst.com.
This article by Simply Wall St is general in nature. We provide commentary based on historical data and analyst forecasts only using an unbiased methodology and our articles are not intended to be financial advice. It does not constitute a recommendation to buy or sell any stock, and does not take account of your objectives, or your financial situation. We aim to bring you long-term focused analysis driven by fundamental data. Note that our analysis may not factor in the latest price-sensitive company announcements or qualitative material. Simply Wall St has no position in any stocks mentioned.
Have feedback on this article? Concerned about the content? Get in touch with us directly. Alternatively, email editorial-team@simplywallst.com
About NYSE:ML
MoneyLion
A financial technology company, provides personalized products and financial content for consumers in the United States.
High growth potential with excellent balance sheet.
Similar Companies
Market Insights

Advertisement
Community Narratives
Groundbreaking therapies that could change the treatment landscape for PTSD, fibromyalgia, MS & Alzheimer’s
Fair Value US$6.20|86.9% undervalued
CM
Community Contributor
DigitalOcean Will Grow 14% by Embracing AI with Paperspace Acquisition
Fair Value US$50.00|42.8% undervalued
NE
Community Contributor
Viant Technology: A Rising AdTech Challenger in the AI-Powered CTV Market
Fair Value US$38.61|66.0% undervalued
BL
Community Contributor
Volvo will Accelerate Forward into Electric and Autonomous Leadership in Five Years
Fair Value SEK 438.80|40.8% undervalued
UN
Community Contributor