Advertisement
- United States
- /
- Capital Markets
- /
- NYSE:JEF
Jefferies Financial Group (JEF): Evaluating Valuation Following a 22% Slide This Month

Simply Wall St
Reviewed by Kshitija Bhandaru
Jefferies Financial Group (JEF) has seen its stock drift lower over the past month, with shares slipping about 22% during this stretch. Recent performance raises questions about what investors are factoring into the company’s valuation right now.
See our latest analysis for Jefferies Financial Group.
Jefferies Financial Group has faced a sharp loss of momentum lately, with a 1-month share price return of -22.4%, amplifying concerns after even steeper drops this week. While short-term sentiment is clearly deteriorating, the story over the past few years remains impressive. A five-year total shareholder return of over 200% still signals significant long-term value creation.
If the recent turbulence has you rethinking your watchlist, now is a great moment to broaden your search and uncover fast growing stocks with high insider ownership
Does Jefferies Financial Group’s recent slide leave the stock undervalued at current prices, or has the market already factored in all of its long-term growth prospects, resulting in limited upside for opportunistic investors?
Price-to-Earnings of 16.4x: Is it justified?
Jefferies Financial Group trades at a price-to-earnings (P/E) ratio of 16.4x, noticeably below both the US market average and its industry peers. At a last close of $50.89, this pricing suggests investors are cautious, especially with recent price declines.
The price-to-earnings ratio measures how much investors are willing to pay for each dollar of the company’s earnings. In capital markets, this is a key signal, often used to compare profitability and expectations of future growth versus those of other firms.
In Jefferies’ case, the P/E ratio is lower than the US market average of 18.9x and well below the industry average of 25.6x. This signals Jefferies may be undervalued relative to its peers, hinting that the market could be discounting its future growth or pricing in additional risks. Notably, the P/E is also below the company’s estimated fair ratio of 17.8x, pointing to more room for a valuation re-rate if business momentum improves.
Explore the SWS fair ratio for Jefferies Financial Group
Result: Price-to-Earnings of 16.4x (UNDERVALUED)
However, persistent declines in short-term returns and a notable slowdown in revenue growth could continue to pressure Jefferies’ valuation if these trends persist.
Find out about the key risks to this Jefferies Financial Group narrative.
Another View: Discounted Cash Flow Paints a Different Picture
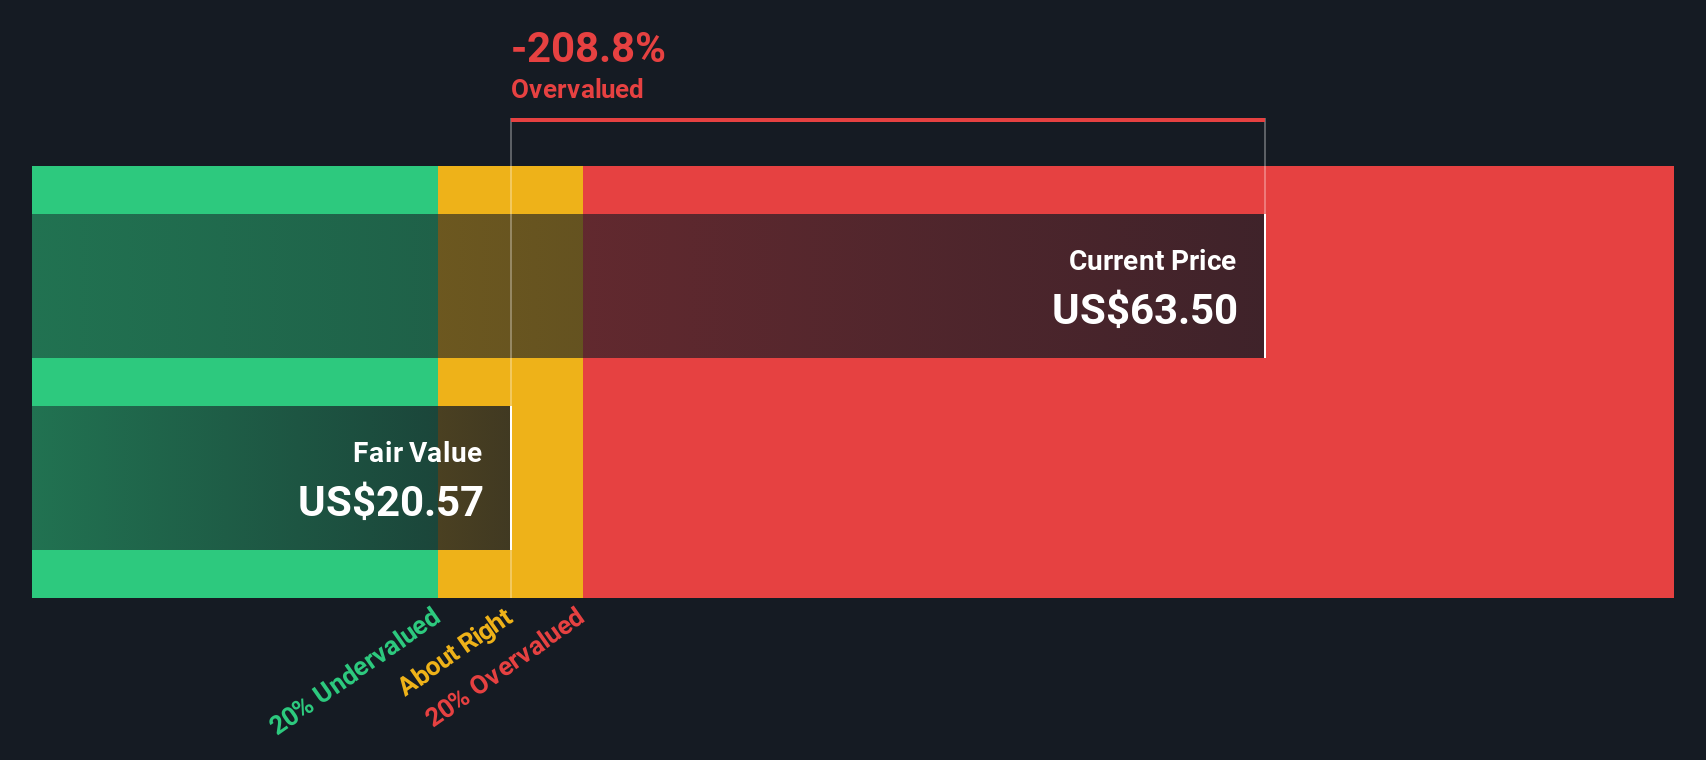
While Jefferies may look undervalued using earnings multiples, our DCF model takes a different approach by estimating future cash flows. Using this method, the current share price of $50.89 is trading well above the calculated fair value of $21.24. Could this indicate that investors are being too optimistic about long-term prospects?
Look into how the SWS DCF model arrives at its fair value.
Simply Wall St performs a discounted cash flow (DCF) on every stock in the world every day (check out Jefferies Financial Group for example). We show the entire calculation in full. You can track the result in your watchlist or portfolio and be alerted when this changes, or use our stock screener to discover undervalued stocks based on their cash flows. If you save a screener we even alert you when new companies match - so you never miss a potential opportunity.
Build Your Own Jefferies Financial Group Narrative
If you have a different perspective or want to dive deeper into the numbers, you can craft your own Jefferies Financial Group narrative in just a few minutes: Do it your way
A great starting point for your Jefferies Financial Group research is our analysis highlighting 4 key rewards and 1 important warning sign that could impact your investment decision.
Looking for more investment ideas?
Smart investors always keep their options open. Level-up your portfolio by targeting hand-picked stocks in trends that could define the next decade.
- Tap into the future by targeting companies pioneering breakthroughs in artificial intelligence with these 24 AI penny stocks.
- Maximize income potential and stability by seeking out these 19 dividend stocks with yields > 3% offering robust yields above 3%.
- Capitalize on rapid growth trends by searching these 3581 penny stocks with strong financials with solid financials that are shaking up the market.
This article by Simply Wall St is general in nature. We provide commentary based on historical data and analyst forecasts only using an unbiased methodology and our articles are not intended to be financial advice. It does not constitute a recommendation to buy or sell any stock, and does not take account of your objectives, or your financial situation. We aim to bring you long-term focused analysis driven by fundamental data. Note that our analysis may not factor in the latest price-sensitive company announcements or qualitative material. Simply Wall St has no position in any stocks mentioned.
New: Manage All Your Stock Portfolios in One Place
We've created the ultimate portfolio companion for stock investors, and it's free.
• Connect an unlimited number of Portfolios and see your total in one currency
• Be alerted to new Warning Signs or Risks via email or mobile
• Track the Fair Value of your stocks
Have feedback on this article? Concerned about the content? Get in touch with us directly. Alternatively, email editorial-team@simplywallst.com
About NYSE:JEF
Jefferies Financial Group
Operates as an investment banking and capital markets firm in the Americas, Europe, the Middle East, and the Asia-Pacific.
Proven track record average dividend payer.
Similar Companies
Market Insights

Advertisement
Community Narratives
A formidable player in AI and enterprise computing.
Fair Value US$210.00|12.2% overvalued
CO
Community Contributor
IREN's Bold Moves in Sustainable Bitcoin Mining & AI Data Centers
Fair Value US$72.52|17.1% undervalued
BL
Community Contributor
Cooling the Champions: The Aussie Tech Behind F1's Victories
Fair Value AU$12.40|38.7% undervalued
TR
Community Contributor