Advertisement
- United States
- /
- Diversified Financial
- /
- NYSE:FIS
Assessing Fidelity National Information Services After Stock Drop and Q1 Earnings Beat

Simply Wall St
Reviewed by Bailey Pemberton
Thinking about what to do with Fidelity National Information Services? You are not alone in weighing your options. The stock has been quite a story for investors, especially over the last several years. If you have been watching the price tickers, you know it has been a bumpy road. The stock closed recently at $67.74, reflecting a 1.1% drop over the past week but eking out a 1.3% gain over the last month. Look back further, though, and the picture is less rosy: returns are down 15.4% year-to-date and a striking 22.3% lower over the past year. For those with an even longer memory, Fidelity National Information Services is trading nearly 46.4% lower than five years ago, a reminder of how quickly market sentiment and business conditions can change.
What is driving these moves? Much of the recent market activity around the stock is tied to shifting investor confidence and changing expectations in the financial technology sector. Developments in broader market trends, including interest rates, evolving digital payments, and competitive pressures, have played a role in shaping risk perception. But as investors, it is not just the past that matters; the real question is what the company’s valuation says about its future upside.
By standard valuation checks, Fidelity National Information Services currently scores a 3 out of 6, suggesting there are some signs it might be undervalued, but it does not stand out as a clear bargain across the board. If you are looking for answers, let us break down the key approaches to valuing the company and, stick around, because at the end we will explore an even smarter way to understand what the numbers mean for your portfolio.
Why Fidelity National Information Services is lagging behind its peers
Approach 1: Fidelity National Information Services Excess Returns Analysis
The Excess Returns model evaluates a company based on how much profit it can generate above its cost of equity, after factoring in the value of shareholders’ invested capital. In essence, it examines the company’s ability to earn more than what investors would expect for the risk taken. This makes it a powerful way to assess underlying business quality and future value creation.
For Fidelity National Information Services, the numbers are telling. The latest estimates place its Book Value at $27.09 per share, with a Stable Book Value projected at $29.64 per share. The company’s Stable Earnings Per Share (EPS) comes in at $6.27, based on a weighted consensus from four analysts. Notably, the Cost of Equity stands at $2.42 per share, while the Excess Return, which is what is left over after covering the cost of equity, is $3.86 per share. The average Return on Equity is a strong 21.17%, which outpaces many peers in the financial technology sector.
Based on this model, the intrinsic value of the stock is estimated to be $105.63 per share. With the recent market price at $67.74, this implies the stock is trading at a 35.9% discount and appears significantly undervalued.
Result: UNDERVALUED
Our Excess Returns analysis suggests Fidelity National Information Services is undervalued by 35.9%. Track this in your watchlist or portfolio, or discover more undervalued stocks.
Approach 2: Fidelity National Information Services Price vs Sales
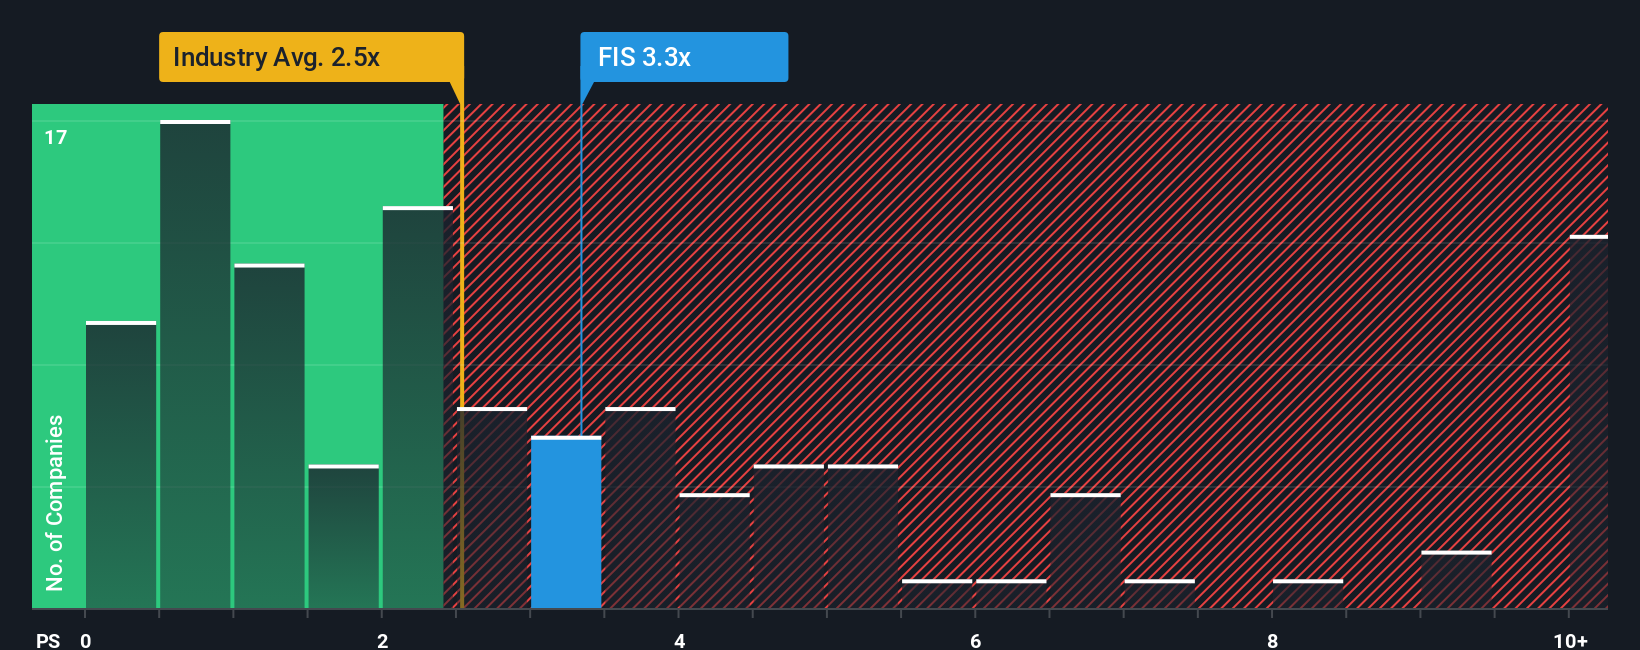
The Price-to-Sales (P/S) ratio is a useful valuation tool for profitable companies like Fidelity National Information Services, especially when earnings may fluctuate or be impacted by non-cash factors. Revenue tends to be a more stable measure of business activity, making the P/S ratio a reliable way to gauge how the market values every dollar of sales the company generates. Companies that are expected to grow quickly or carry less risk usually command higher P/S multiples, while slower-growing or riskier companies trade at lower ratios.
At the moment, Fidelity National Information Services trades at a P/S of 3.43x. For context, this is above the Diversified Financial industry average of 2.58x and also higher than the peer average of 2.75x. On the surface, this premium might look concerning. Are investors overpaying for the company’s sales, or does the market see reasons for optimism?
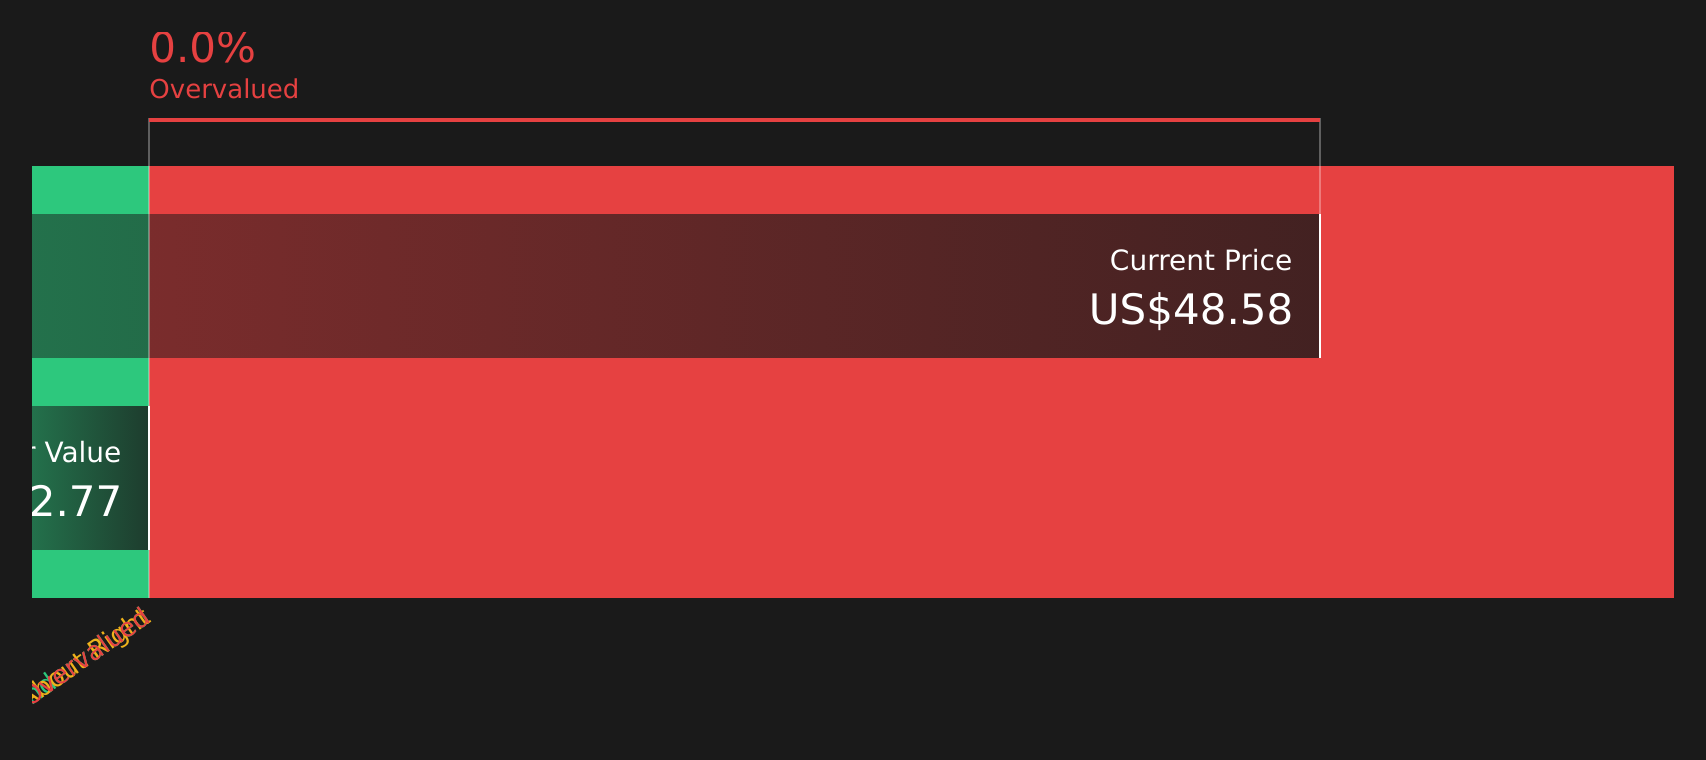
This is where Simply Wall St’s proprietary “Fair Ratio” comes in. The Fair Ratio for Fidelity National Information Services is 3.16x. This is a more nuanced benchmark that reflects the company’s unique earnings growth, margin profile, risk characteristics, and its position in the industry. Unlike standard peer or sector comparisons, the Fair Ratio adapts to the company’s actual financial health and prospects, offering a more targeted assessment of value.
Comparing the current P/S to the Fair Ratio, Fidelity National Information Services trades only slightly above the calculated fair value multiple. The difference is minor, so the stock looks fairly valued by this measure.
Result: ABOUT RIGHT
PS ratios tell one story, but what if the real opportunity lies elsewhere? Discover companies where insiders are betting big on explosive growth.
Upgrade Your Decision Making: Choose your Fidelity National Information Services Narrative
Earlier we mentioned that there is an even better way to understand valuation, so let us introduce you to Narratives. A Narrative is simply your story about a company’s future; it is where you connect your view of Fidelity National Information Services’ prospects (like fair value, revenue and earnings forecasts, and future profit margins) to a reasoned, personal outlook. Narratives go beyond numbers by linking a company’s story to a financial forecast and then a fair value, helping you clarify why you believe the stock is a buy, sell, or hold.
On Simply Wall St’s Community page, millions of investors use Narratives as an accessible tool for forming and sharing these viewpoints, no spreadsheets needed. Narratives help you track your investment thesis, compare your fair value to the latest price, and decide when new news or earnings might warrant a change of view, as Narratives update dynamically when the facts change.
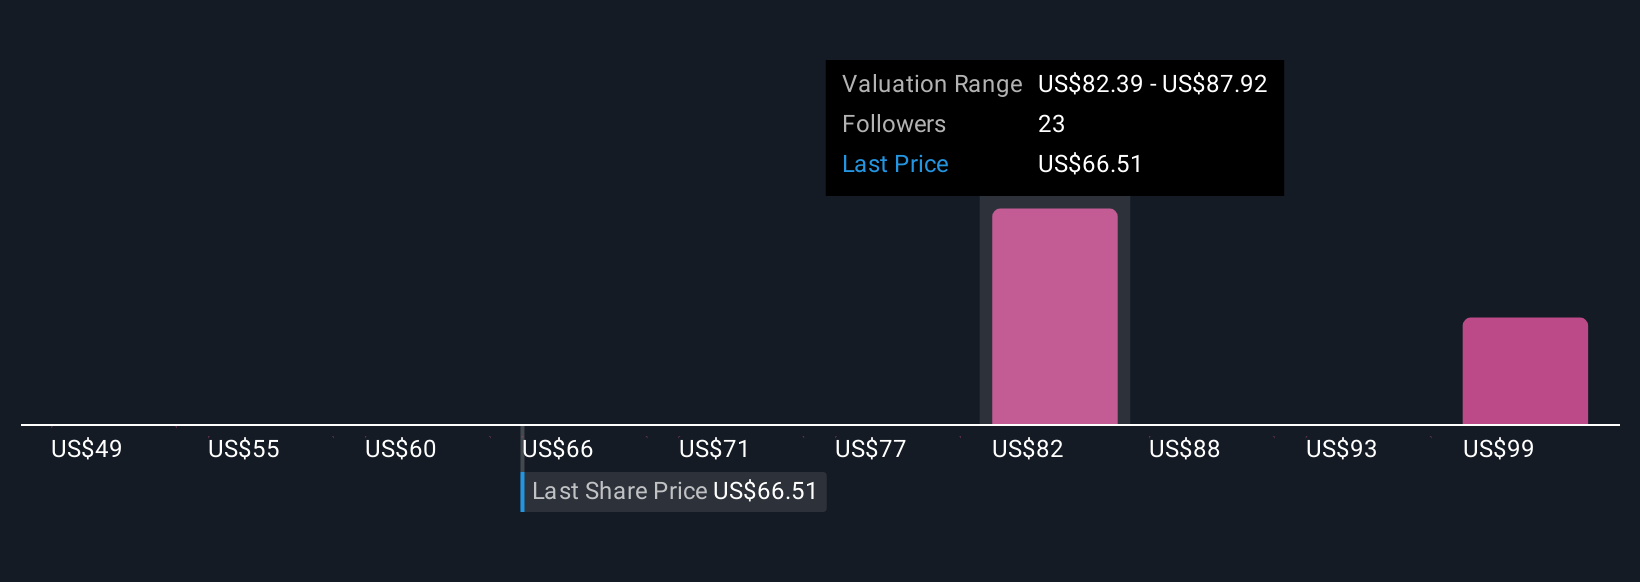
For example, some investors see digital payment adoption and cloud fintech driving higher revenues and assign a fair value up to $100, suggesting significant upside. Others, wary of industry disruption or margin pressures, estimate fair value at $70; so even looking at the same company and data, your Narrative helps you decide when the price is right for you.
Do you think there's more to the story for Fidelity National Information Services? Create your own Narrative to let the Community know!
This article by Simply Wall St is general in nature. We provide commentary based on historical data and analyst forecasts only using an unbiased methodology and our articles are not intended to be financial advice. It does not constitute a recommendation to buy or sell any stock, and does not take account of your objectives, or your financial situation. We aim to bring you long-term focused analysis driven by fundamental data. Note that our analysis may not factor in the latest price-sensitive company announcements or qualitative material. Simply Wall St has no position in any stocks mentioned.
New: AI Stock Screener & Alerts
Our new AI Stock Screener scans the market every day to uncover opportunities.
• Dividend Powerhouses (3%+ Yield)
• Undervalued Small Caps with Insider Buying
• High growth Tech and AI Companies
Or build your own from over 50 metrics.
Have feedback on this article? Concerned about the content? Get in touch with us directly. Alternatively, email editorial-team@simplywallst.com
About NYSE:FIS
Fidelity National Information Services
Fidelity National Information Services, Inc.
Reasonable growth potential with slight risk.
Similar Companies
Market Insights

Advertisement
Community Narratives
A formidable player in AI and enterprise computing.
Fair Value US$210.00|3.9% overvalued
CO
Community Contributor
IREN's Bold Moves in Sustainable Bitcoin Mining & AI Data Centers
Fair Value US$89.00|21.8% undervalued
BL
Community Contributor
Cooling the Champions: The Aussie Tech Behind F1's Victories
Fair Value AU$12.40|40.6% undervalued
TR
Community Contributor