Advertisement
- United States
- /
- Diversified Financial
- /
- NYSE:BRK.B
How Does Berkshire Compare to Rivals After Its Five-Year 130% Return?

Simply Wall St
Reviewed by Bailey Pemberton
If you are on the fence about what to do with your Berkshire Hathaway shares, or are wondering whether now is the moment to take the plunge, you are not alone. For anyone tracking the stock market’s giants, Berkshire is a familiar puzzle: steady but never exactly predictable. Over the past year, shares have delivered a 6.3% return, not exactly setting Wall Street ablaze, but hardly a reason for panic. Yet, zoom out, and you see a different story: up 8.4% year-to-date and an incredible 130.8% over five years. Even after a quiet month, with the stock dipping just 0.9%, the long-term growth trend is hard to ignore.
This movement did not materialize out of thin air. Big-picture market shifts, like changes in interest rates and investor appetite for diversified conglomerates, play a role in how Berkshire is valued at any given moment. Amid a mix of cautious optimism and sporadic jitters across the markets, Berkshire has often benefitted from a perception of safety and resilience. This reputation does not always translate into wild price swings, but can lead to slow, steady gains.
So how does Berkshire actually stack up when you put a magnifying glass to its valuation? On a scale of 0 to 6, with a higher score signaling more signs of undervaluation, Berkshire Hathaway earns a solid 4. That tells us the stock is passing most, but not all, of the common undervaluation checks. Up next, we will break down those methods in more detail and see what is really driving the numbers. And stick around until the end, because there is an even smarter way to think about value that goes beyond any scorecard.
Approach 1: Berkshire Hathaway Excess Returns Analysis
The Excess Returns valuation approach analyzes how efficiently Berkshire Hathaway generates returns on its capital above the company’s cost of equity. This method emphasizes the difference between what the business earns and what shareholders would expect as a minimum return, factoring in both profitability and growth in book value over time.
For Berkshire Hathaway, the key numbers tell an intriguing story. The company’s book value stands at $464,307.83 per share, with a stable earnings-per-share estimate of $64,432.73. The average return on equity over the past five years is a solid 13.00%, significantly higher than the estimated cost of equity at $37,723.02 per share. This results in an excess return of $26,709.72 per share, indicating that Berkshire does far better than simply clearing its financial hurdle. Looking ahead, analysts forecast a stable book value of $495,490.17 per share, suggesting expectations for steady future growth.
Based on these calculations, the intrinsic value suggested by the Excess Returns model is considerably above the current share price. With an estimated discount of 32.3%, the stock appears to be notably undervalued by the market.
Result: UNDERVALUED
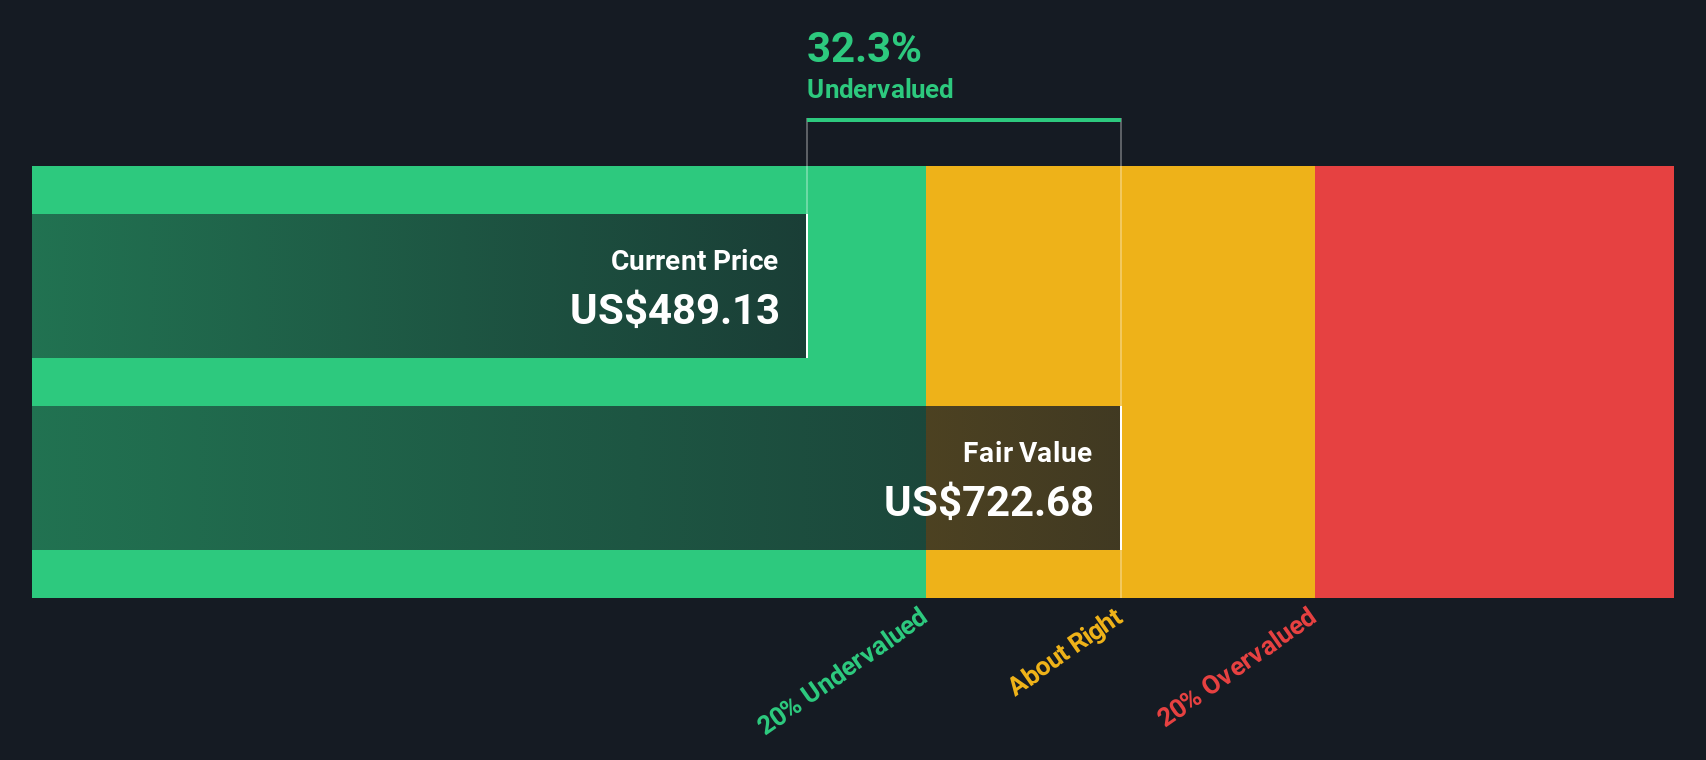
Our Excess Returns analysis suggests Berkshire Hathaway is undervalued by 32.3%. Track this in your watchlist or portfolio, or discover more undervalued stocks.
Approach 2: Berkshire Hathaway Price vs Earnings
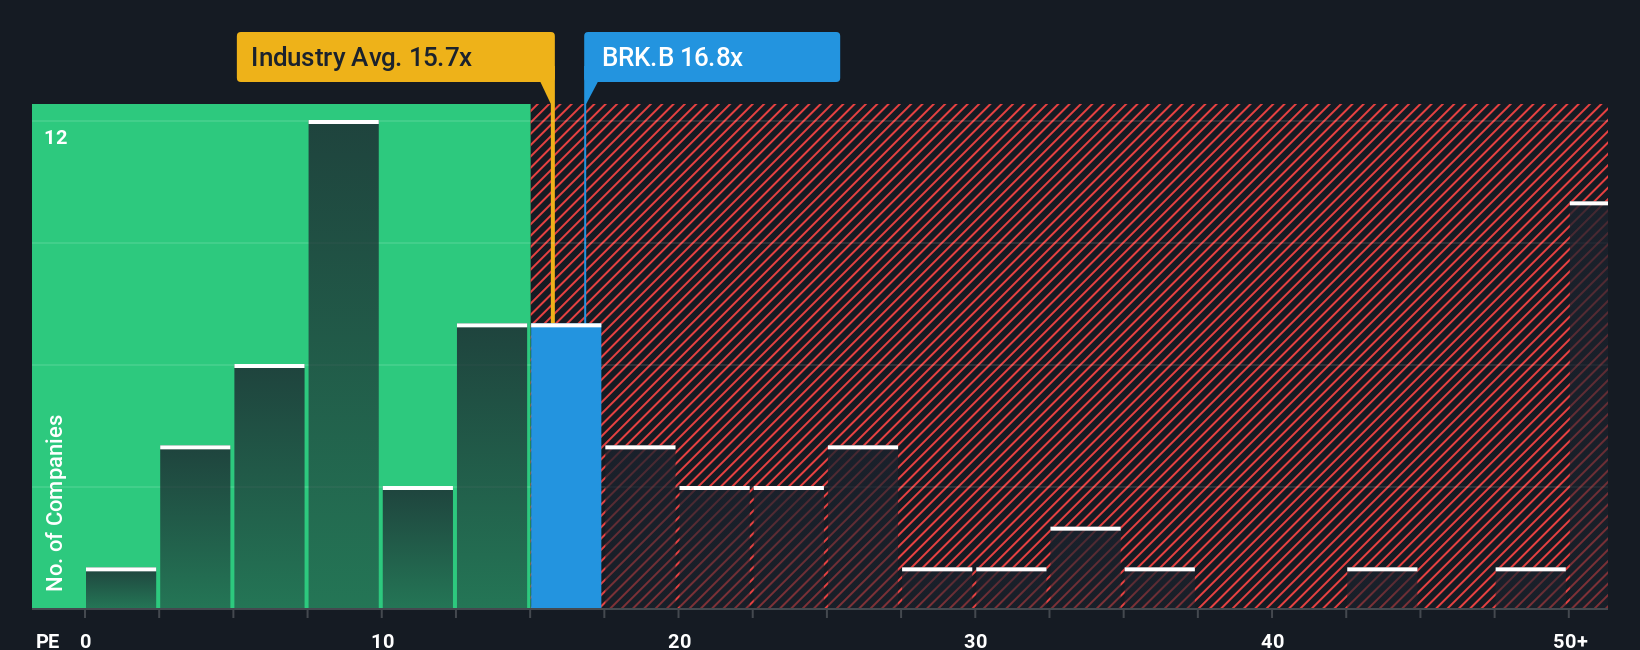
The Price-to-Earnings (PE) ratio is a widely used metric for evaluating profitable companies like Berkshire Hathaway, as it tells investors how much they are paying for each dollar of earnings. A lower PE can signal that a stock is potentially undervalued, while a higher PE might reflect strong growth expectations or a lower risk profile. In general, the right PE ratio depends not just on a company's earnings today, but also how quickly those earnings are expected to grow and the level of risk the company carries.
Berkshire Hathaway is currently trading at a PE ratio of 16.8x. To put this in perspective, the industry average PE for diversified financial firms is 15.7x, while Berkshire’s peer group averages a higher PE of 25.9x. This positions Berkshire below its peers but slightly above the broader industry. However, simply comparing these numbers does not always capture the full picture. Consider the “Fair Ratio,” Simply Wall St’s proprietary valuation metric. Berkshire’s Fair Ratio is calculated at 19.8x, a figure that takes into account the company’s unique earnings growth profile, risk factors, profit margins, industry dynamics, and market capitalization.
What makes the Fair Ratio useful is that it goes beyond a one-size-fits-all industry average or basic peer comparison. It holistically evaluates how Berkshire stacks up given its specific strengths, risks, and growth trajectory. When comparing the Fair Ratio (19.8x) to Berkshire’s actual PE ratio (16.8x), the stock still appears undervalued, as the current multiple is noticeably below what would be considered fair based on these comprehensive factors.
Result: UNDERVALUED
PE ratios tell one story, but what if the real opportunity lies elsewhere? Discover companies where insiders are betting big on explosive growth.
Upgrade Your Decision Making: Choose your Berkshire Hathaway Narrative
Earlier, we mentioned there is an even better way to understand valuation, so let us introduce you to Narratives. A Narrative is a simple yet powerful tool that lets you link the story you believe about a company, like your expectations for its future revenue, earnings, and profit margins, to a financial forecast and a fair value estimate.
By telling your own story with the numbers, you create a clear connection between Berkshire Hathaway’s unique journey and your assessment of what it is worth. Narratives make this process accessible and dynamic, available right on Simply Wall St’s Community page where millions of investors create and share their perspectives.
With Narratives, deciding when to buy or sell becomes straightforward: you can easily compare your Fair Value to the current Price, and see if the numbers align with your outlook. As new information like earnings reports or important news arrives, Narratives update automatically so your estimates and story stay current.
For example, one investor’s Narrative might forecast strong growth and assign Berkshire a higher fair value, while another expects modest returns and sets a lower value. This helps everyone invest with more clarity and confidence.
Do you think there's more to the story for Berkshire Hathaway? Create your own Narrative to let the Community know!
This article by Simply Wall St is general in nature. We provide commentary based on historical data and analyst forecasts only using an unbiased methodology and our articles are not intended to be financial advice. It does not constitute a recommendation to buy or sell any stock, and does not take account of your objectives, or your financial situation. We aim to bring you long-term focused analysis driven by fundamental data. Note that our analysis may not factor in the latest price-sensitive company announcements or qualitative material. Simply Wall St has no position in any stocks mentioned.
Valuation is complex, but we're here to simplify it.
Discover if Berkshire Hathaway might be undervalued or overvalued with our detailed analysis, featuring fair value estimates, potential risks, dividends, insider trades, and its financial condition.
Access Free AnalysisHave feedback on this article? Concerned about the content? Get in touch with us directly. Alternatively, email editorial-team@simplywallst.com
About NYSE:BRK.B
Berkshire Hathaway
Through its subsidiaries, engages in the insurance, freight rail transportation, and utility businesses.
Flawless balance sheet and good value.
Similar Companies
Market Insights

Advertisement
Community Narratives
A formidable player in AI and enterprise computing.
Fair Value US$210.00|10.9% overvalued
CO
Community Contributor
IREN's Bold Moves in Sustainable Bitcoin Mining & AI Data Centers
Fair Value US$72.52|12.0% undervalued
BL
Community Contributor
Cooling the Champions: The Aussie Tech Behind F1's Victories
Fair Value AU$12.40|38.7% undervalued
TR
Community Contributor