Advertisement
- United States
- /
- Capital Markets
- /
- NasdaqGS:HOOD
Is Robinhood’s Rally Sustainable After Recent Crypto Trading Expansion?

Simply Wall St
Reviewed by Bailey Pemberton
If you’ve ever wondered whether now’s the time to jump into Robinhood Markets or lock in some impressive gains, you’re definitely not alone. After all, this is a stock that’s grabbed attention by skyrocketing 240.1% year-to-date and a jaw-dropping 398.1% over the past year. It’s delivered an astonishing 1,226.9% return in just three years. Even so, things aren’t all smooth sailing. In the last week, shares pulled back by 11.1%, a pause that has some investors questioning just how much higher Robinhood can go from here.
What’s behind these major moves? Enthusiasm around Robinhood’s evolving business and the broader boom in active trading have kept momentum strong, particularly as new traders enter the market. However, market sentiment has shown signs of shifting, with recent volatility reflecting a mix of optimism and some healthy skepticism about whether the rally has run too far, too fast.
Given this backdrop, valuation becomes more important than ever. Our latest checks give Robinhood Markets a value score of 0 out of 6, signaling that the usual models suggest it isn’t trading below fair value by any conventional metric. But does that tell the whole story? Let’s break down how these valuation checks work and why relying solely on this score might mean missing out on the bigger picture. Stay tuned for a smarter way to look at this stock’s potential at the end.
Robinhood Markets scores just 0/6 on our valuation checks. See what other red flags we found in the full valuation breakdown.
Approach 1: Robinhood Markets Excess Returns Analysis
The Excess Returns valuation model focuses on measuring how much more Robinhood Markets earns on its invested equity compared to its cost of capital. In simple terms, it examines whether the company is generating value beyond what investors require as a minimum return.
For Robinhood, the model uses several key figures:
- Book Value: $9.09 per share
- Stable EPS: $2.51 per share (source: weighted future Return on Equity estimates from 7 analysts)
- Cost of Equity: $1.04 per share
- Excess Return: $1.47 per share
- Average Return on Equity: 20.12%
- Stable Book Value: $12.47 per share (source: weighted future Book Value estimates from 4 analysts)
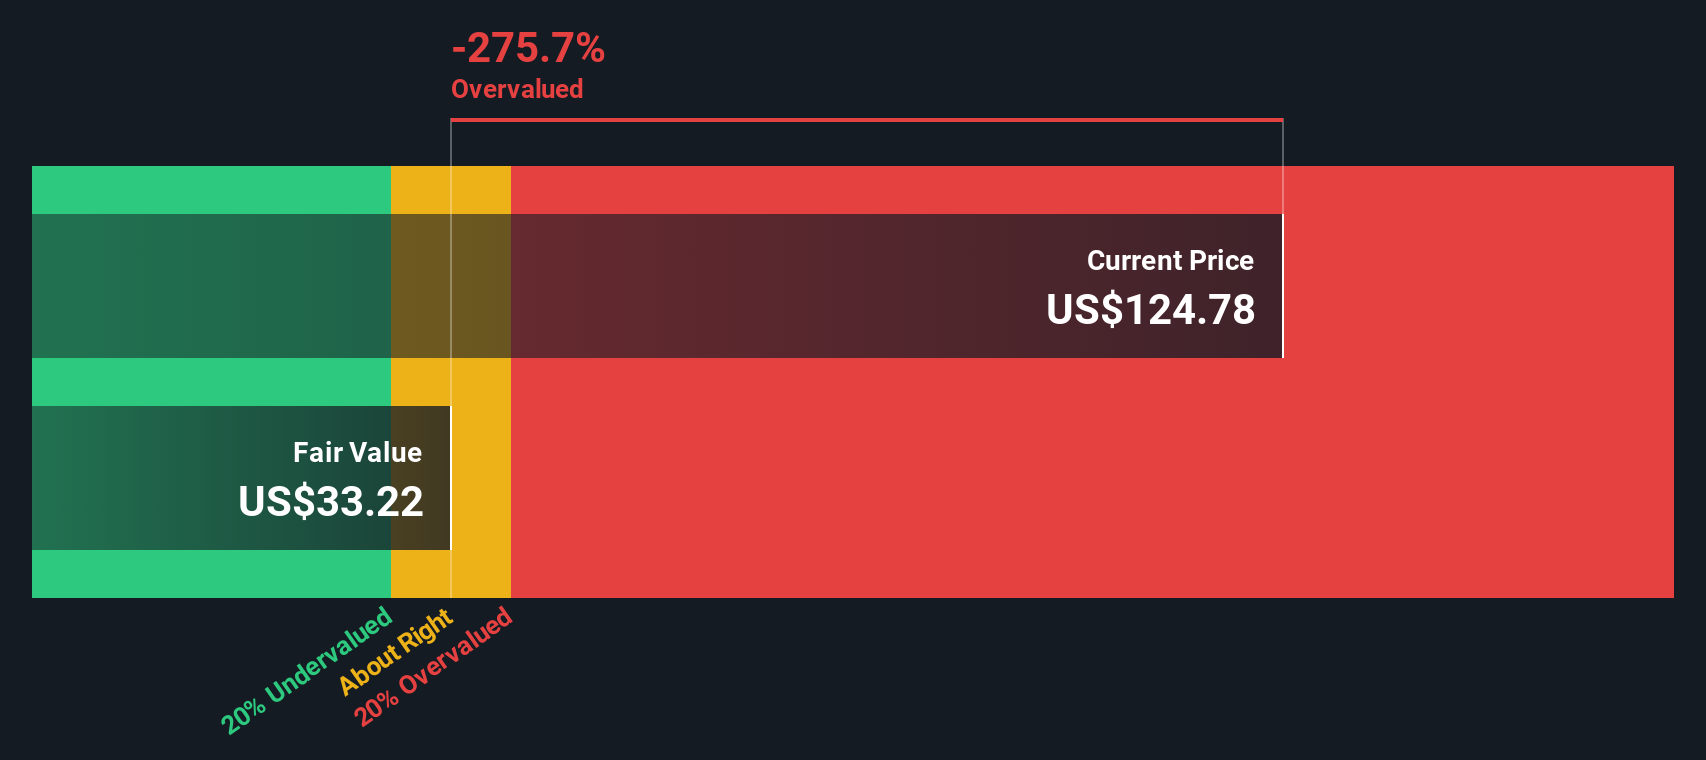
This analysis suggests Robinhood is earning returns well above its cost of equity, a sign of quality and potential forward-looking profitability. However, the estimated intrinsic value from the Excess Returns model is significantly below the current market price. The stock is considered 232.2% overvalued based on this approach, meaning the market's optimism appears much higher than what these fundamentals currently justify.
Result: OVERVALUED
Our Excess Returns analysis suggests Robinhood Markets may be overvalued by 232.2%. Find undervalued stocks or create your own screener to find better value opportunities.
Approach 2: Robinhood Markets Price vs Earnings
For steady, profitable companies like Robinhood Markets, the price-to-earnings (PE) ratio is a key metric investors use to determine whether a stock’s price reflects its true earnings power. The PE ratio helps you compare how much you are paying for one dollar of the company’s profits, making it especially relevant for businesses consistently generating net income.
What counts as a "normal" or "fair" PE ratio depends on expectations for growth and the level of risk. Generally, higher growth prospects and lower risk justify a higher PE ratio, while slower growth or greater uncertainty deserve a lower multiple.
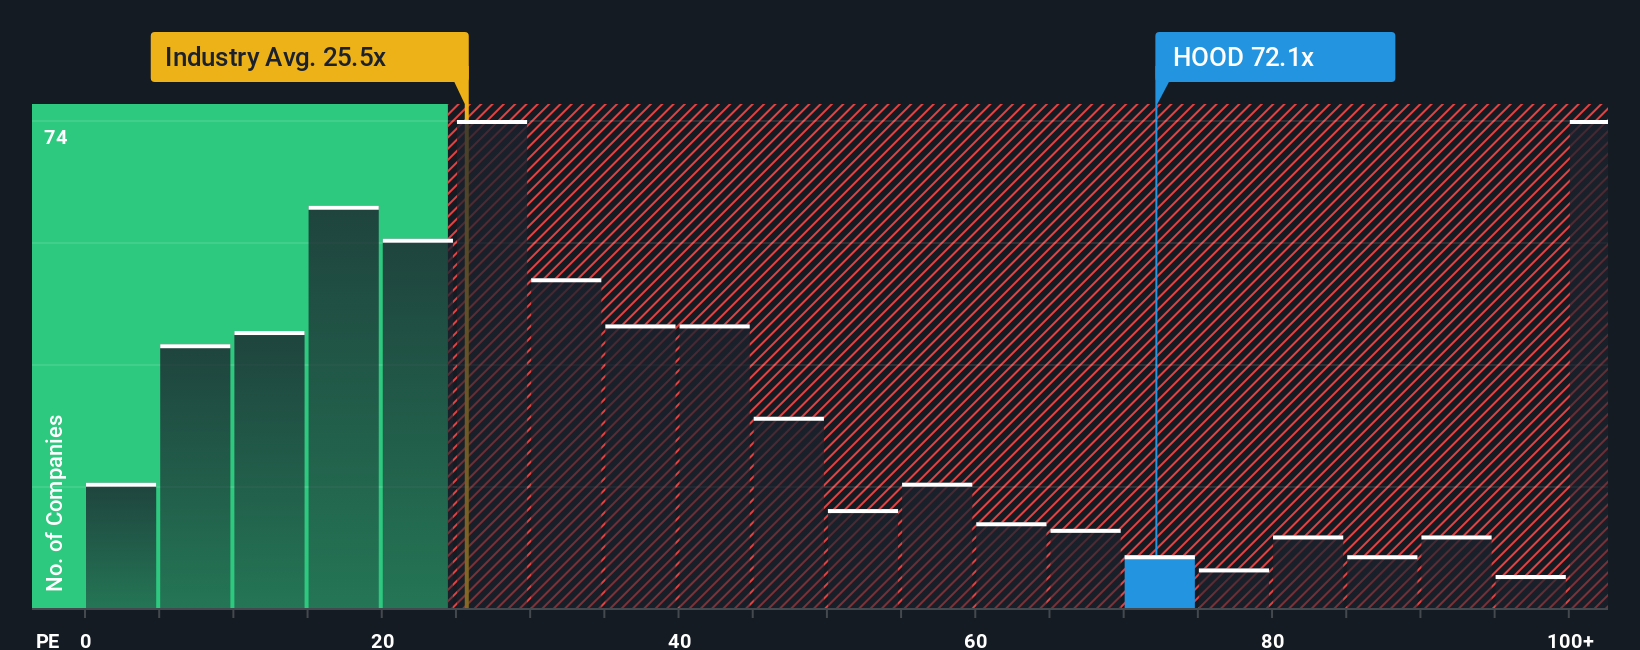
Currently, Robinhood Markets trades at a lofty PE ratio of 66.7x. This stands well above the Capital Markets industry average of 25.7x and the peer average of 23.6x. At first glance, this could suggest the stock's price is disconnected from its current profitability.
However, Simply Wall St’s proprietary Fair Ratio model provides a more nuanced view. The Fair Ratio for Robinhood comes in at 23.6x. This metric is tailored to reflect factors that matter most, such as the company’s earnings growth expectations, risk profile, margins, industry characteristics, and market capitalization. By using the Fair Ratio, investors get a more complete picture than by looking solely at broad industry or peer group comparisons.
With Robinhood’s actual PE ratio (66.7x) dramatically higher than its Fair Ratio (23.6x), the stock appears significantly overvalued when judged by earnings-based multiples.
Result: OVERVALUED
PE ratios tell one story, but what if the real opportunity lies elsewhere? Discover companies where insiders are betting big on explosive growth.
Upgrade Your Decision Making: Choose your Robinhood Markets Narrative
Earlier we mentioned that there's an even better way to make sense of a stock's valuation, so let's introduce you to Narratives. A Narrative is your personal perspective on Robinhood Markets, allowing you to shape a story behind the numbers by combining your assumptions about future revenue, earnings, and profit margins. Narratives connect a company’s unique journey to a financial forecast and, ultimately, to a fair value. This empowers you to understand the “why” behind every valuation.
Narratives are available as an intuitive tool on Simply Wall St’s Community page, used by millions of investors to bring clarity and context to buy or sell decisions. By mapping out your view, you can instantly compare your Fair Value estimate with the latest price, helping you act with conviction or caution. Narratives are dynamic; as new information, news, or earnings come in, your forecasts and fair values update in real time so you’re never left behind.
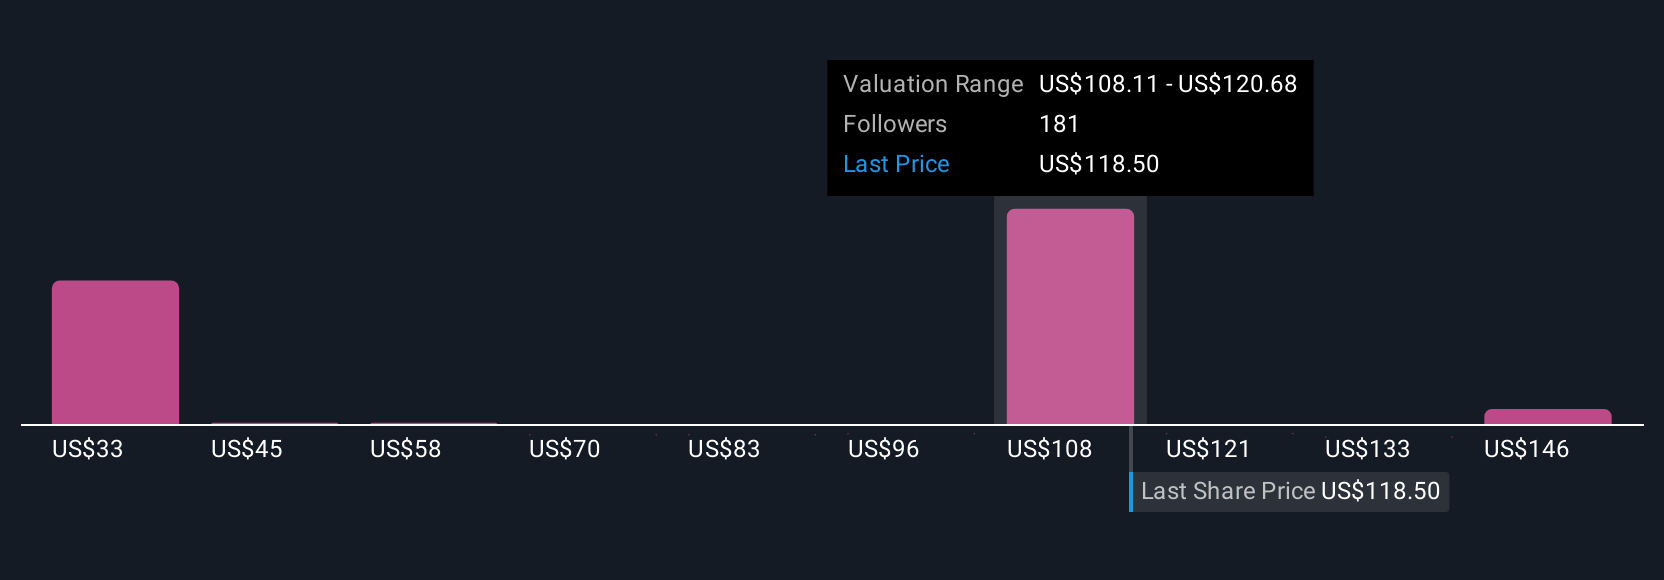
For example, some investors may view Robinhood’s rapid expansion and innovation as justification for a high fair value, seeing price targets near $160. Others may emphasize regulatory risks and margin pressures, arriving at a much more conservative value close to $50.
Do you think there's more to the story for Robinhood Markets? Create your own Narrative to let the Community know!
This article by Simply Wall St is general in nature. We provide commentary based on historical data and analyst forecasts only using an unbiased methodology and our articles are not intended to be financial advice. It does not constitute a recommendation to buy or sell any stock, and does not take account of your objectives, or your financial situation. We aim to bring you long-term focused analysis driven by fundamental data. Note that our analysis may not factor in the latest price-sensitive company announcements or qualitative material. Simply Wall St has no position in any stocks mentioned.
New: AI Stock Screener & Alerts
Our new AI Stock Screener scans the market every day to uncover opportunities.
• Dividend Powerhouses (3%+ Yield)
• Undervalued Small Caps with Insider Buying
• High growth Tech and AI Companies
Or build your own from over 50 metrics.
Have feedback on this article? Concerned about the content? Get in touch with us directly. Alternatively, email editorial-team@simplywallst.com
About NasdaqGS:HOOD
Robinhood Markets
Operates financial services platform in the United States.
Solid track record with adequate balance sheet.
Similar Companies
Market Insights

Advertisement
Community Narratives
A formidable player in AI and enterprise computing.
Fair Value US$210.00|13.6% overvalued
CO
Community Contributor
IREN's Bold Moves in Sustainable Bitcoin Mining & AI Data Centers
Fair Value US$89.00|23.6% undervalued
BL
Community Contributor
Cooling the Champions: The Aussie Tech Behind F1's Victories
Fair Value AU$12.40|40.6% undervalued
TR
Community Contributor